
Did you know that pumpkin spice products generate over $500 million in sales each year? Hungry for more Halloween pumpkin sales statistics? If so, join us on the journey into the spooky, surprising world of Halloween marketing!
As the leaves turn and jack-o’-lanterns start to grin, businesses are brewing up their Halloween strategies.
But before you put on that witch hat or vampire fangs, let’s dive into some eye-opening Halloween spending trends. These fun facts and figures will help you carve out a frighteningly effective campaign for the spookiest night. Let’s get started!
Top Halloween Statistics at a Glance
This article compiles the most important Halloween statistics for 2026, covering participation rates, consumer spending, candy sales, decorations, trick-or-treating, and other Halloween marketing trends that shape how people celebrate the holiday.
- Halloween spending reached $13.1 billion in 2025, up from $11.6 billion in 2024;
- 73% of U.S. consumers celebrated Halloween in 2025, showing consistently high participation levels;
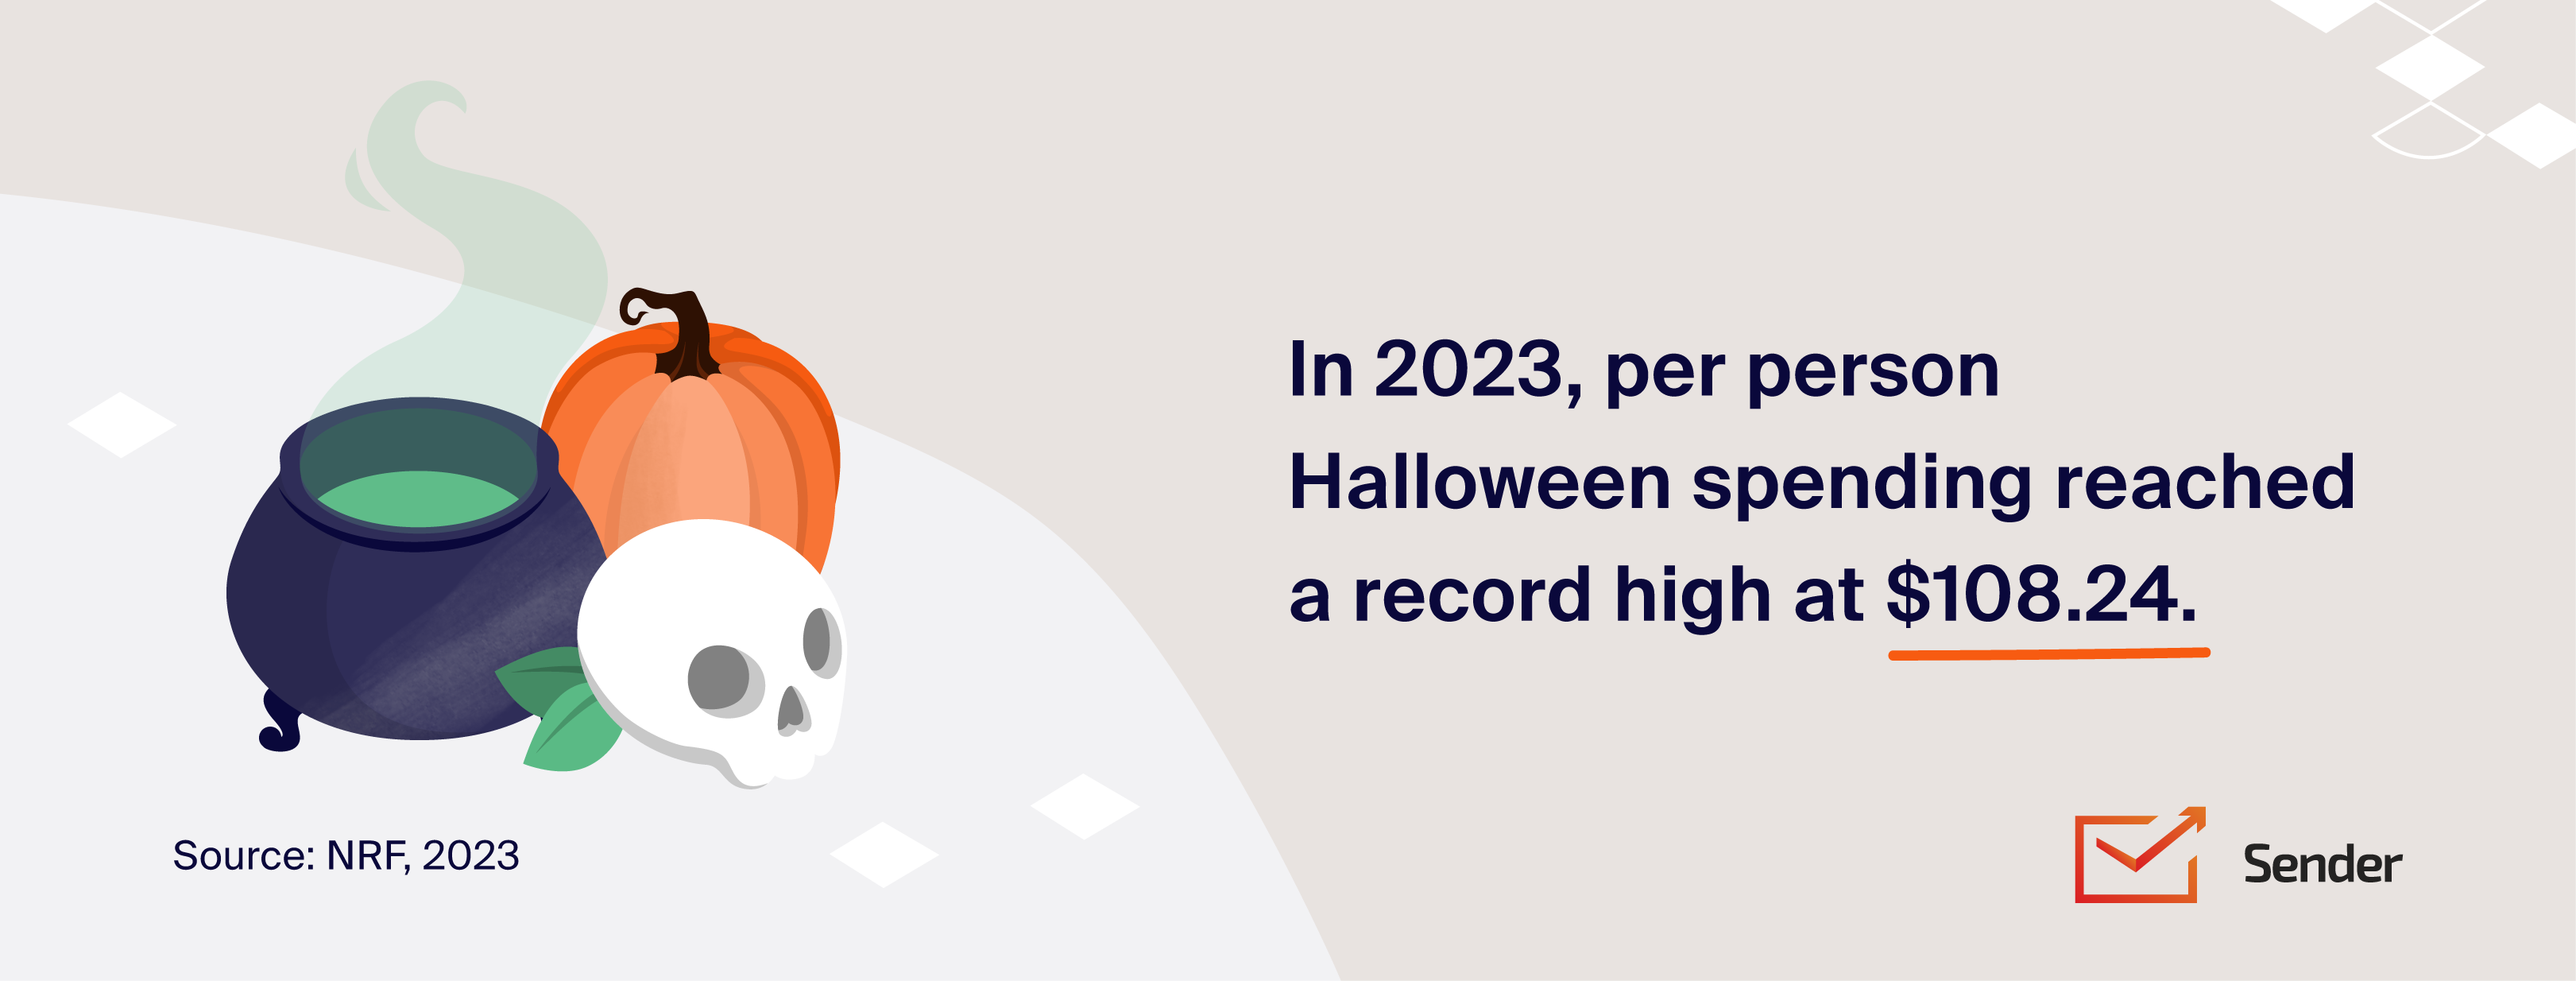
- The average person spent $114.45 on Halloween in 2025, compared to $103.63 in 2024;
- Costumes were the biggest spending category, reaching $4.3 billion in 2025;
- Halloween decoration sales crossed $4.2 billion in 2025;
- Halloween candy spending reached $3.9 billion in 2025;
- 67% of households plan to hand out candy, making it the most common Halloween activity;
- 43% of Americans carve pumpkins as part of their Halloween celebrations.
Halloween by the Numbers
Halloween Participation & Demographic Statistics
This article compiles the most important Halloween statistics for 2026, covering participation rates, consumer spending, candy sales, decorations, trick-or-treating trends, and marketing insights that shape how people celebrate the holiday.
- 73% of US consumers celebrated Halloween in 2025, up from 69% in 2022;
- 67% of households plan to hand out candy, making it the most common Halloween activity;
- 43% of Americans carve pumpkins, keeping the jack-o’-lantern tradition one of the most popular Halloween activities;
- Gen Z and Millennials show the highest participation rates, with about 71% saying they celebrate Halloween.
Consumer Spending Statistics
Halloween is one of the biggest seasonal retail events of the year, with billions spent on costumes, decorations, and candy. The Halloween seasonal retail trends below highlight how much consumers spend during the holiday and which product categories generate the highest sales.
- Halloween spending reached $13.1 billion in 2025, up from $11.6 billion in 2024 and above the previous record of $12.2 billion in 2023;
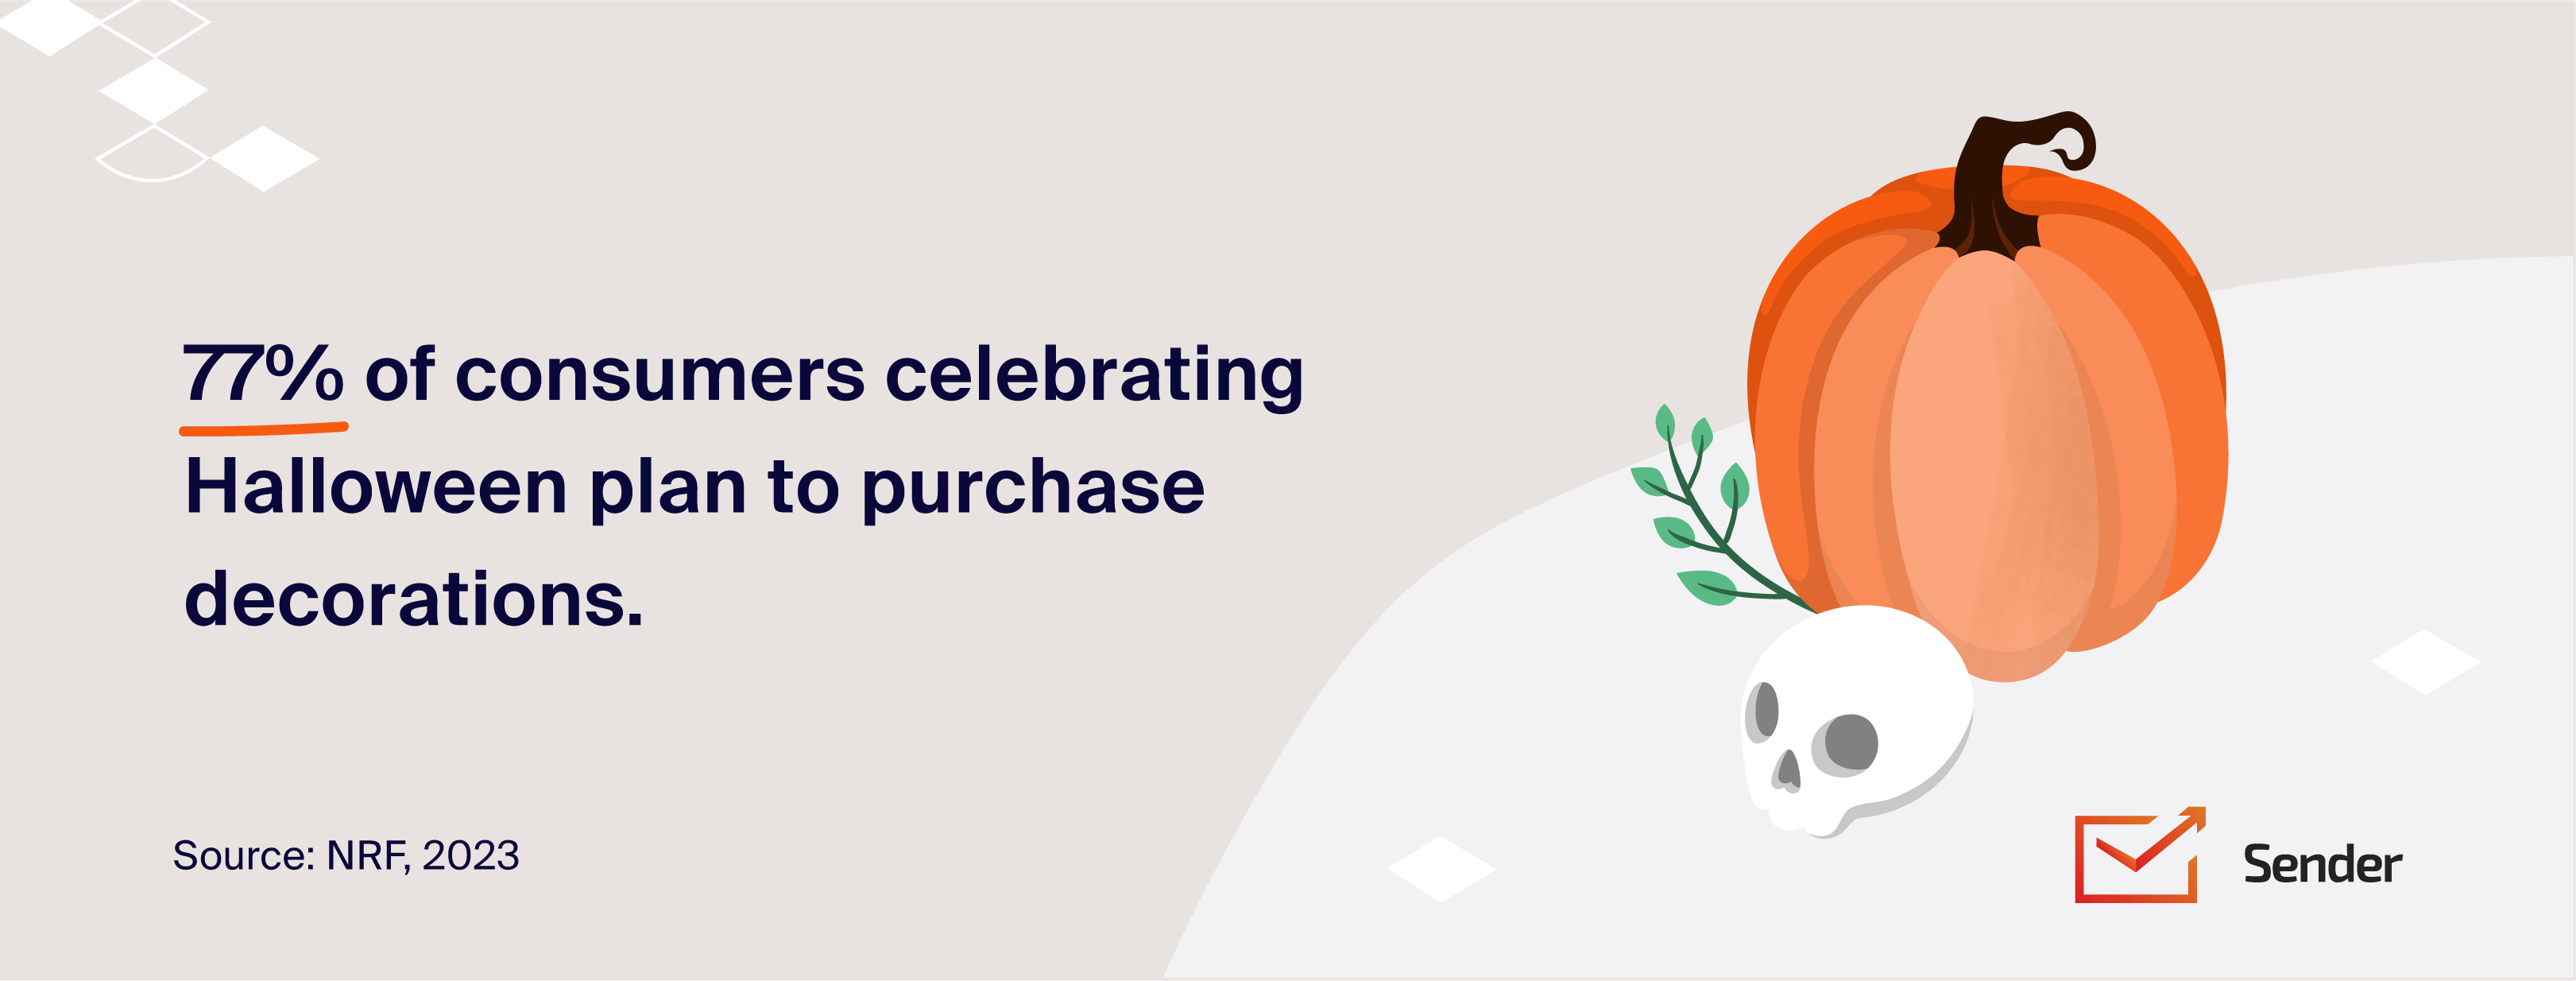
- 78% planned to buy decorations, with spending in this category estimated at $4.2 billion.
Candy Statistics
Candy is at the center of Halloween celebrations, making it one of the most important seasonal products each year. The statistics below highlight how much Americans spend on Halloween candy and which treats are the most popular.
- Halloween candy spending is still massive, with U.S. consumers expected to spend $4.5 billion on candy in 2025;
- 75% of US households say they will opt for chocolate candies in 2026;
- The Beehive State, Juta, orders 50% more candy than the national average (on Instacart);
- Chocolate bars and variety pack candies are the most popular, with sales for variety packs rising by 886% in the week leading up to Halloween;
- More than 36% of Americans say Reese’s Peanut Butter Cups are their favorite Halloween treat. Not surprisingly, it was the #1 Halloween candy in 2024.
Decoration Statistics
From glowing jack-o’-lanterns to full front-yard haunted displays, Halloween decorations have become a huge part of the celebration. The statistics below reveal how Americans decorate and how decoration trends continue to grow each year.
- 52% of consumers in the US decorate their homes, while 49% plan to wear costumes during the holiday;
- 68% of households decorate outside for Halloween and 61% decorate inside, both rising steadily from 62% and 58% in 2023, and 30% and 26% in 2022, respectively;
- Pumpkins remain the favorite type of décor (50%), followed by animatronics or moving decorations and inflatables (21%) and skeletons/skulls (18%).
Trick-or-Treating Statistics
Trick-or-treating remains one of the most popular Halloween traditions, bringing millions of children into neighborhoods each year in search of candy and costumes. The statistics below highlight how families participate in trick-or-treating and what households expect on Halloween night.
- Most trick-or-treaters (74%) stay within their own neighborhoods;
- Among those handing out treats, 61% expect 25 or more children, while 13% expect over 100;
- While many homes participate, some reports in 2023 indicated that a majority of households (74% in one poll) saw fewer trick-or-treaters than in previous years;
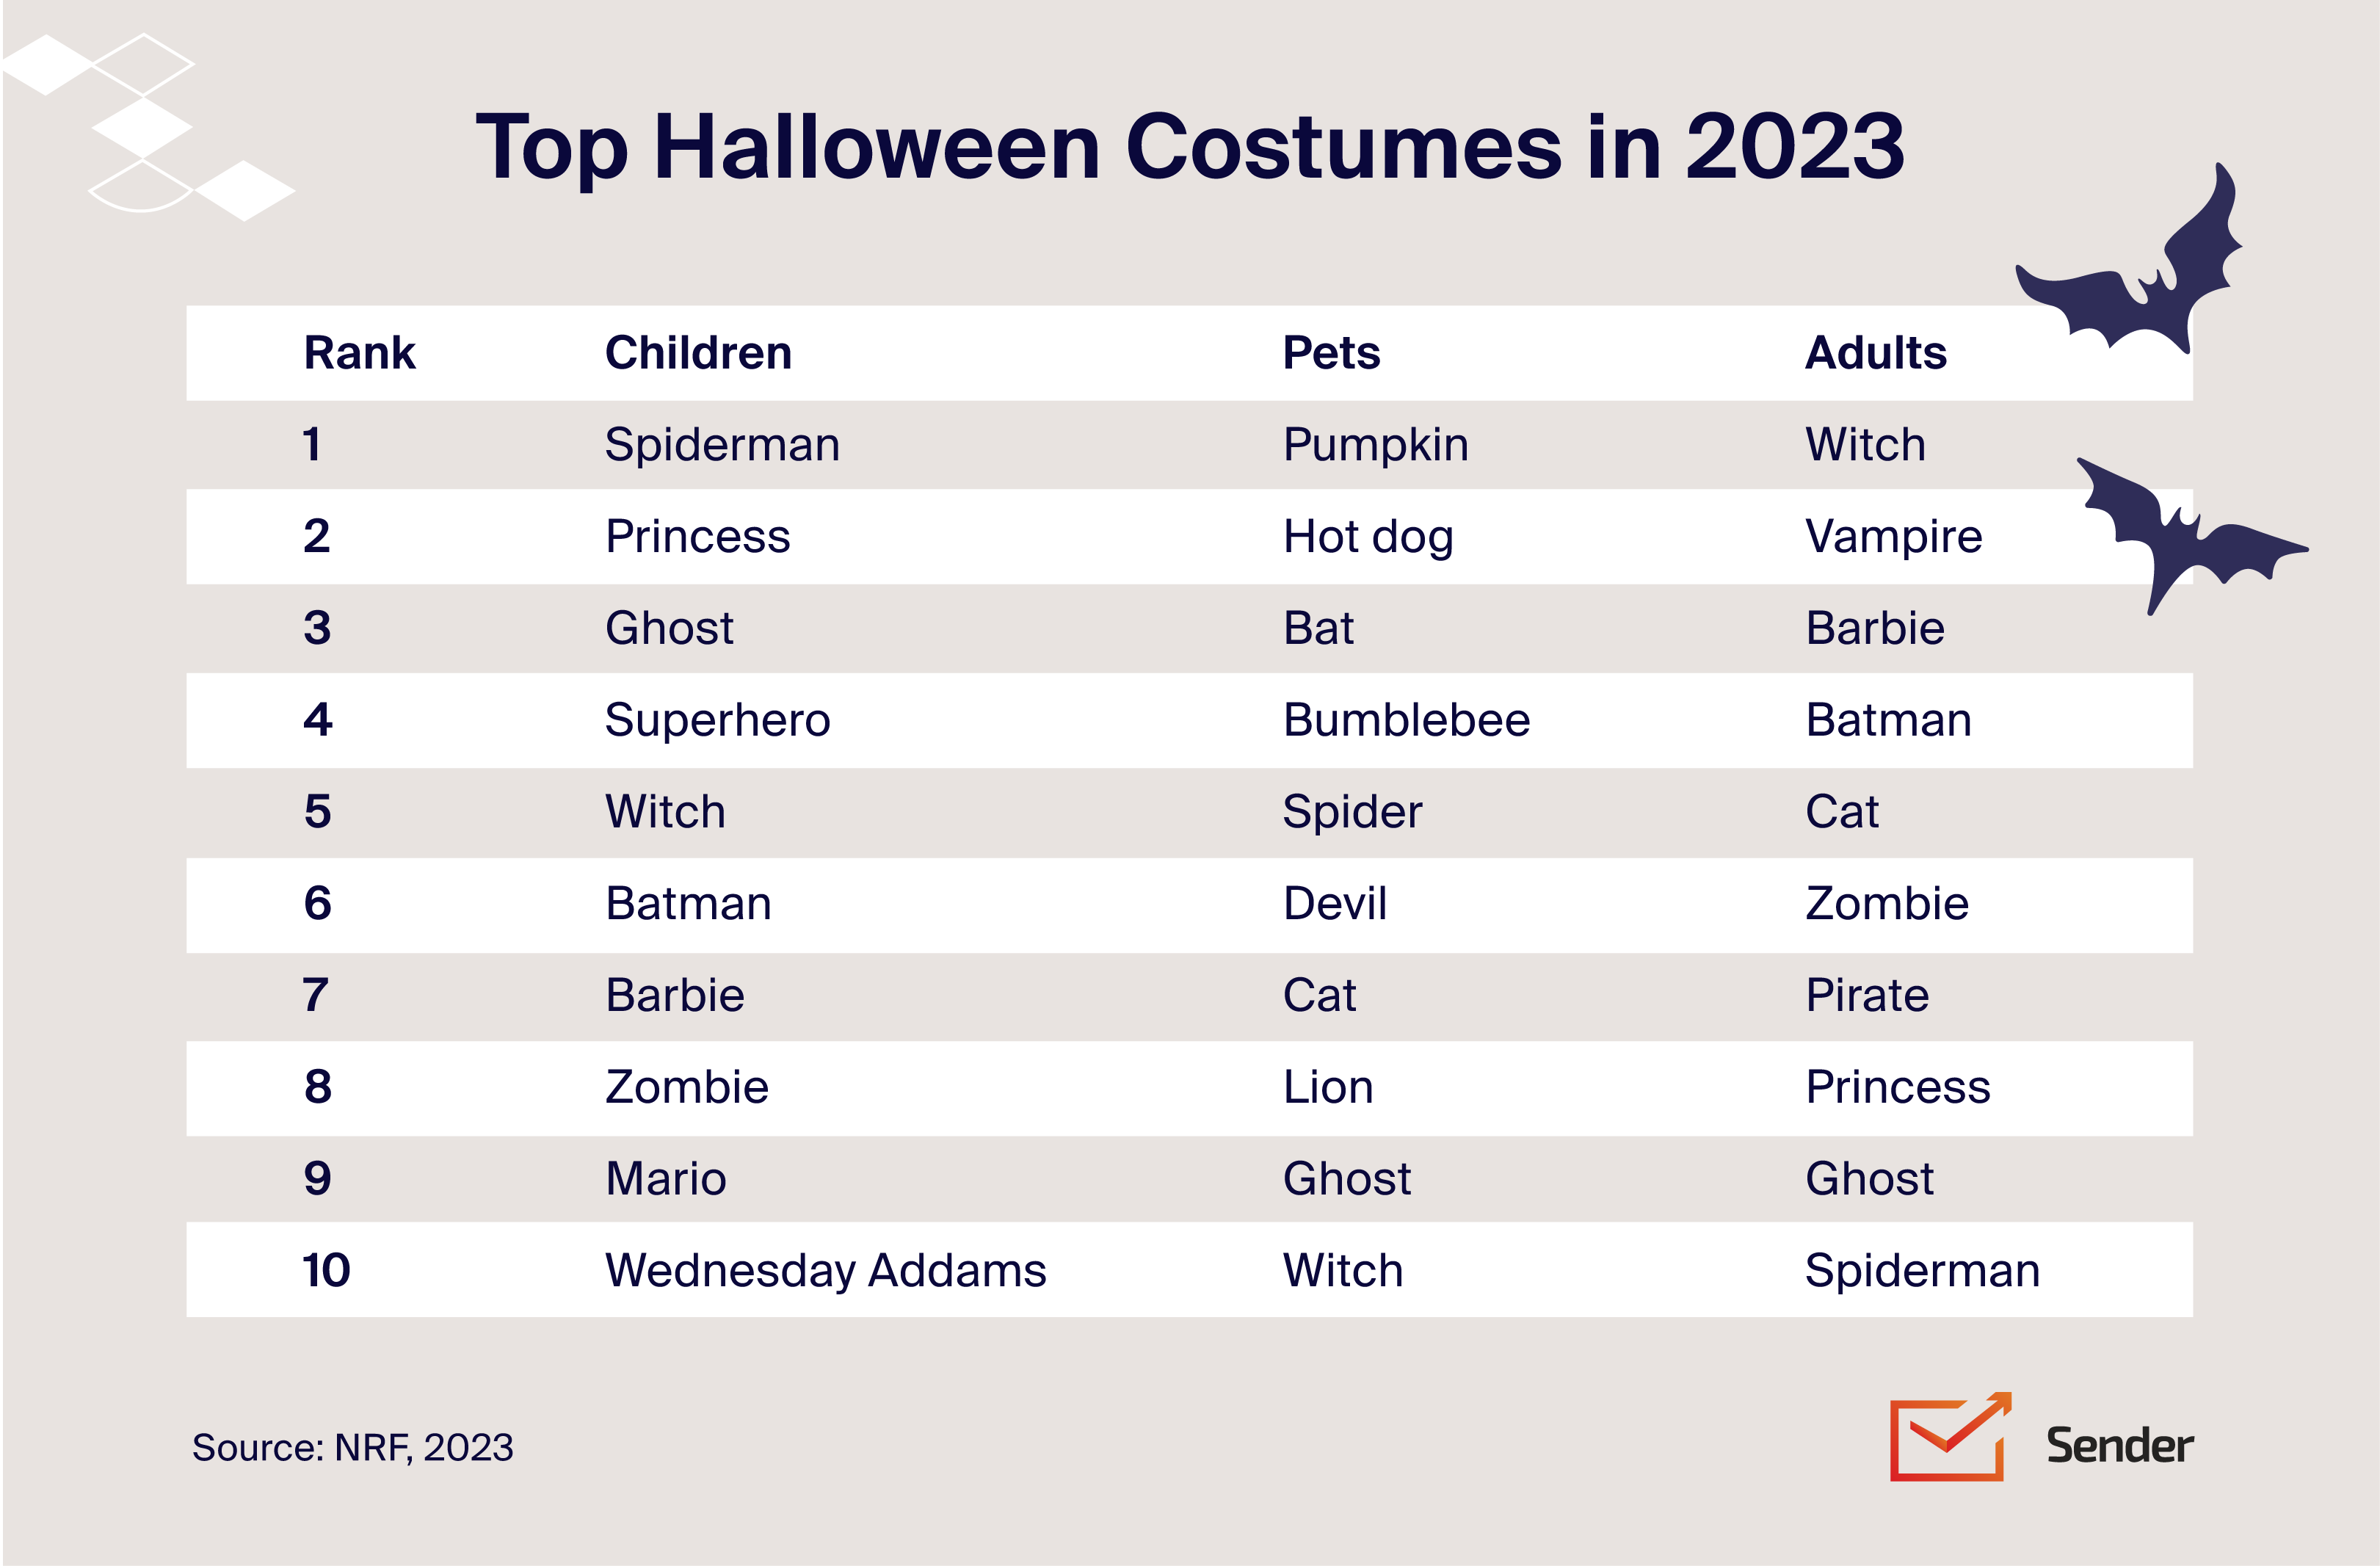
- 2.3 million children plan to dress as Spider-Man in 2026, followed by 1.9 million as princesses.
Halloween Marketing Statistics
Ready to explore Halloween product popularity statistics for your marketing campaigns? No need to search multiple pages for holiday shopping statistics – everything you need is right here.
We’ve gathered key insights to help you understand how Americans spend during Halloween.
Halloween Shopping Behavior
According to the National Retail Federation, the Halloween market size reached a record $13.1 billion in 2025, up from $11.6 billion in 2024 and above the previous record of $12.2 billion in 2023. NRF analysts expect Halloween spending to remain at similar levels in 2026.
However, economic factors—such as potential tariffs on imported goods, particularly since much Halloween merchandise is sourced from China—could still influence pricing and consumer spending patterns.
Here’s Halloween by the numbers:
- 73% of households plan to participate in Halloween-related activities in 2026, consistent with 2025’s record;
- In 2025, the average person celebrating Halloween spent $114.45, up from $103.63 in 2024;
- The costume category recorded the highest spending total, with consumers spending $4.3 billion on costumes in 2025.
- Total Halloween decoration sales crossed $4.2 billion;
- Halloween candy spending reached $3.9 billion in 2025, making candy the most popular Halloween purchase category.
Consumer Behavior Insights
People love to shop for Halloween, decorate their homes, and engage in fun activities during this time. Here’s the Halloween shopping timeline statistics and behavioral ones, too, to inform your marketing campaigns:
- 47% of consumers celebrating Halloween plan to buy costumes and decor;
- 56% of consumers plan to start shopping for Halloween before October;
- Nearly half of shoppers (49%) started buying Halloween items in September or earlier in 2025;
- 79% of Halloween shoppers expected prices to be higher in 2025, yet most still planned to celebrate.
Halloween Costume Shopping
Halloween sales data about people’s preferences for Halloween costumes can give a lot of insights into Halloween promotional success. For example, demand for pet costumes has been growing recently.
Here are some facts about Halloween costumes for the year:
- Most adults had already decided on a Halloween costume in 2025, with 75% saying they knew what they would dress up as;
- In 2025, about 5.6 million adults dressed as witches, followed by 2.7 million vampires, while pirates, cats, and Batman costumes each attracted around 1.6 million adults;
- In 2025, the most popular pet Halloween costumes were pumpkin, hot dog, bumblebee, ghost, and superhero.
Social Media Influence
Instagram and TikTok are the top platforms for costume ideas and inspiration around Halloween. Here’s some data on social media engagement for Halloween and its influence on Halloween celebrations.
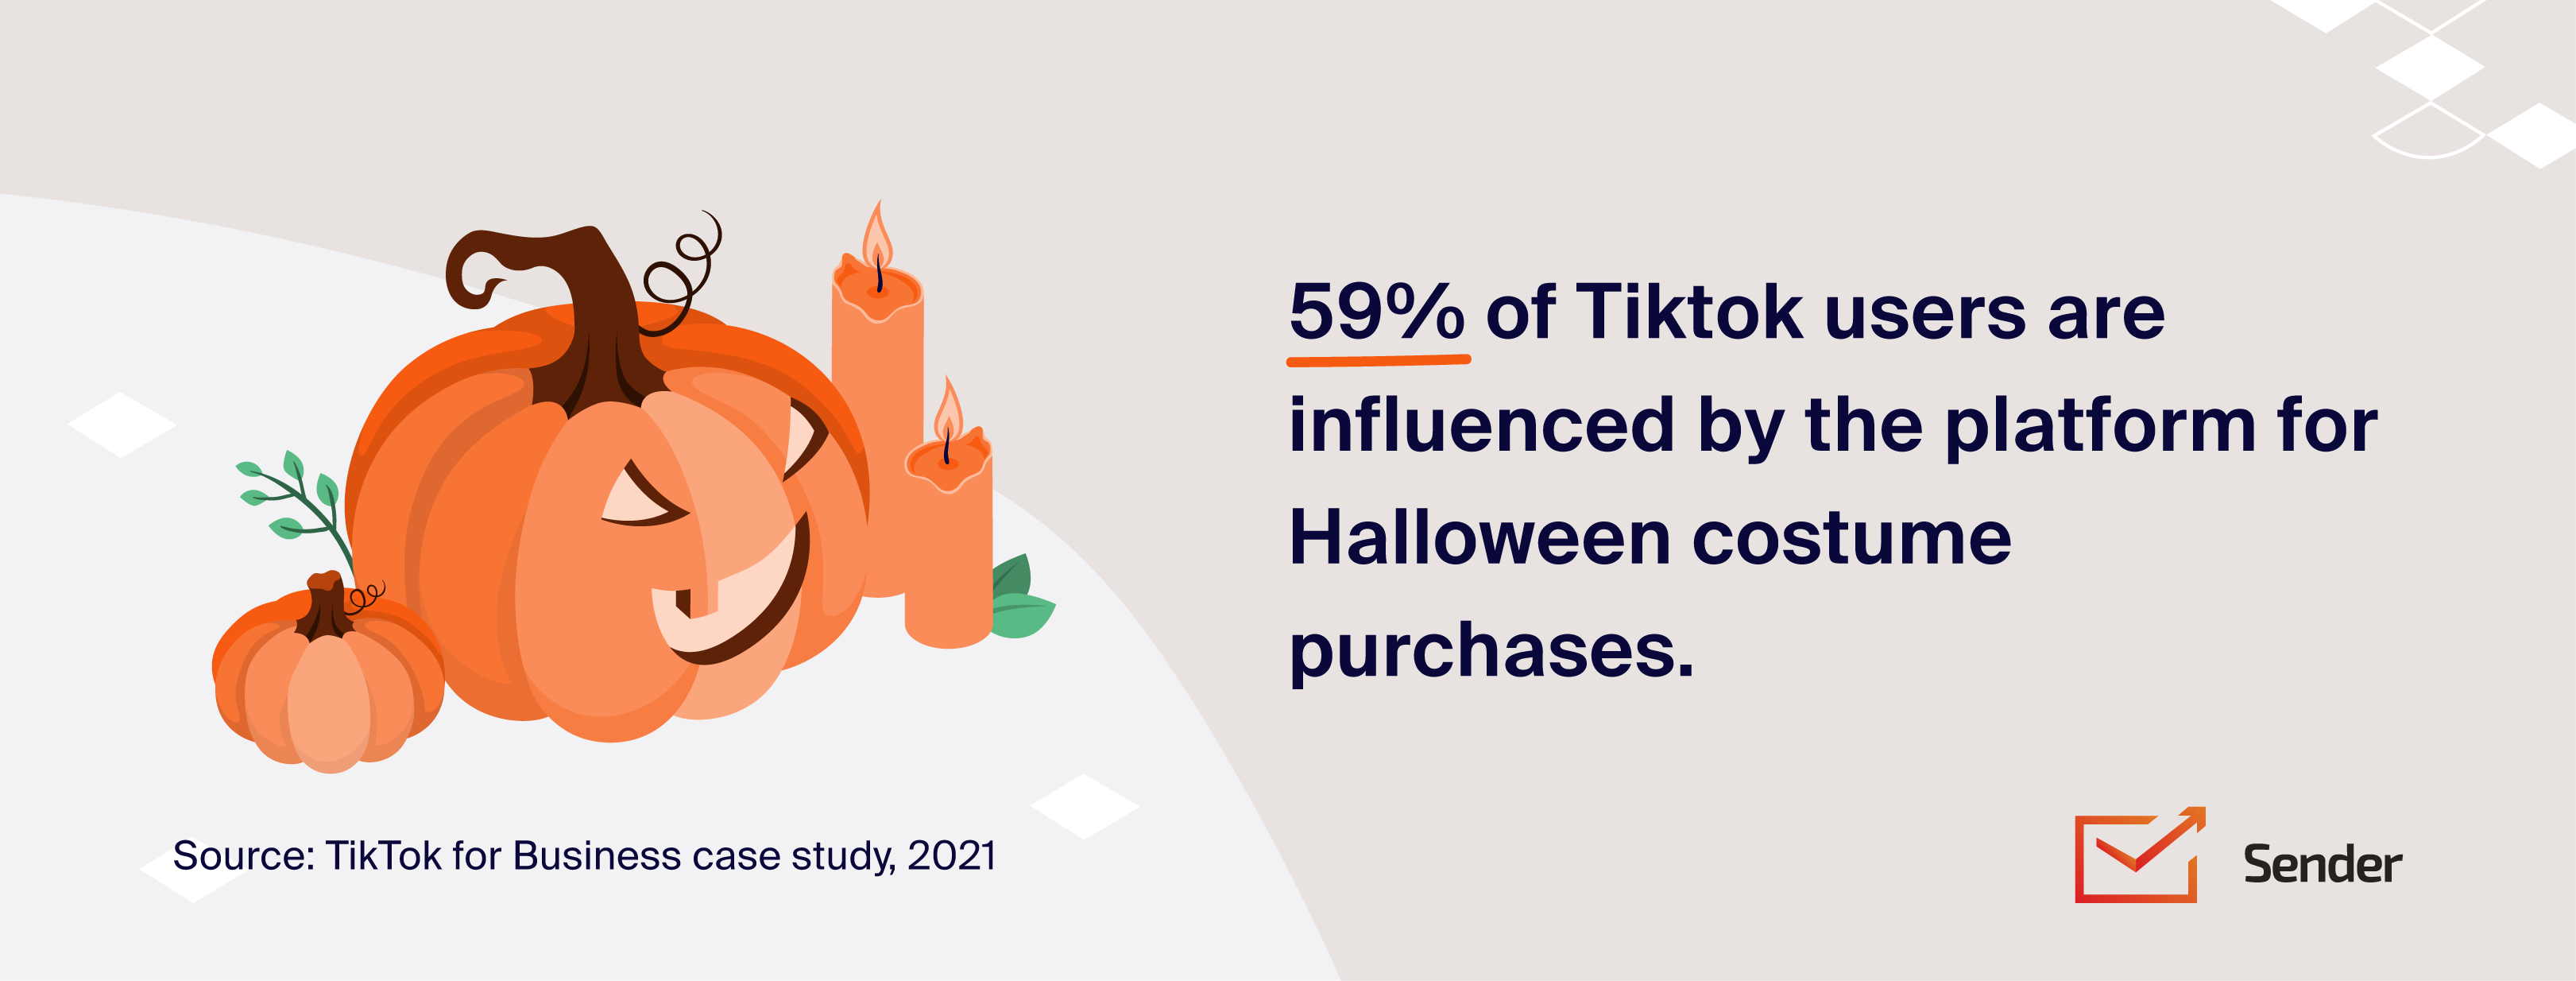
- 59% of TikTok users are influenced by the platform for Halloween costume purchases;
- 42% of consumers bought sweets and chocolate inspired by TikTok trends;
- 55% of TikTok users search for sweets and chocolate content on the platform;
- Nearly 40% said they would gather inspiration by looking for Halloween ideas online in 2025;
- 30% of Gen-Zs and 26% of all adults turn to YouTube for Halloween inspiration.
Online Shopping Trends
People are open to shopping online for their Halloween costumes and decor picks. Here are some Halloween retail sales statistics, as well as some Halloween ecommerce statistics thrown in for good measure:
- Adobe Analytics indicates that online sales for Halloween products grew by 16% year-over-year, with mobile devices accounting for 40% of the purchases;
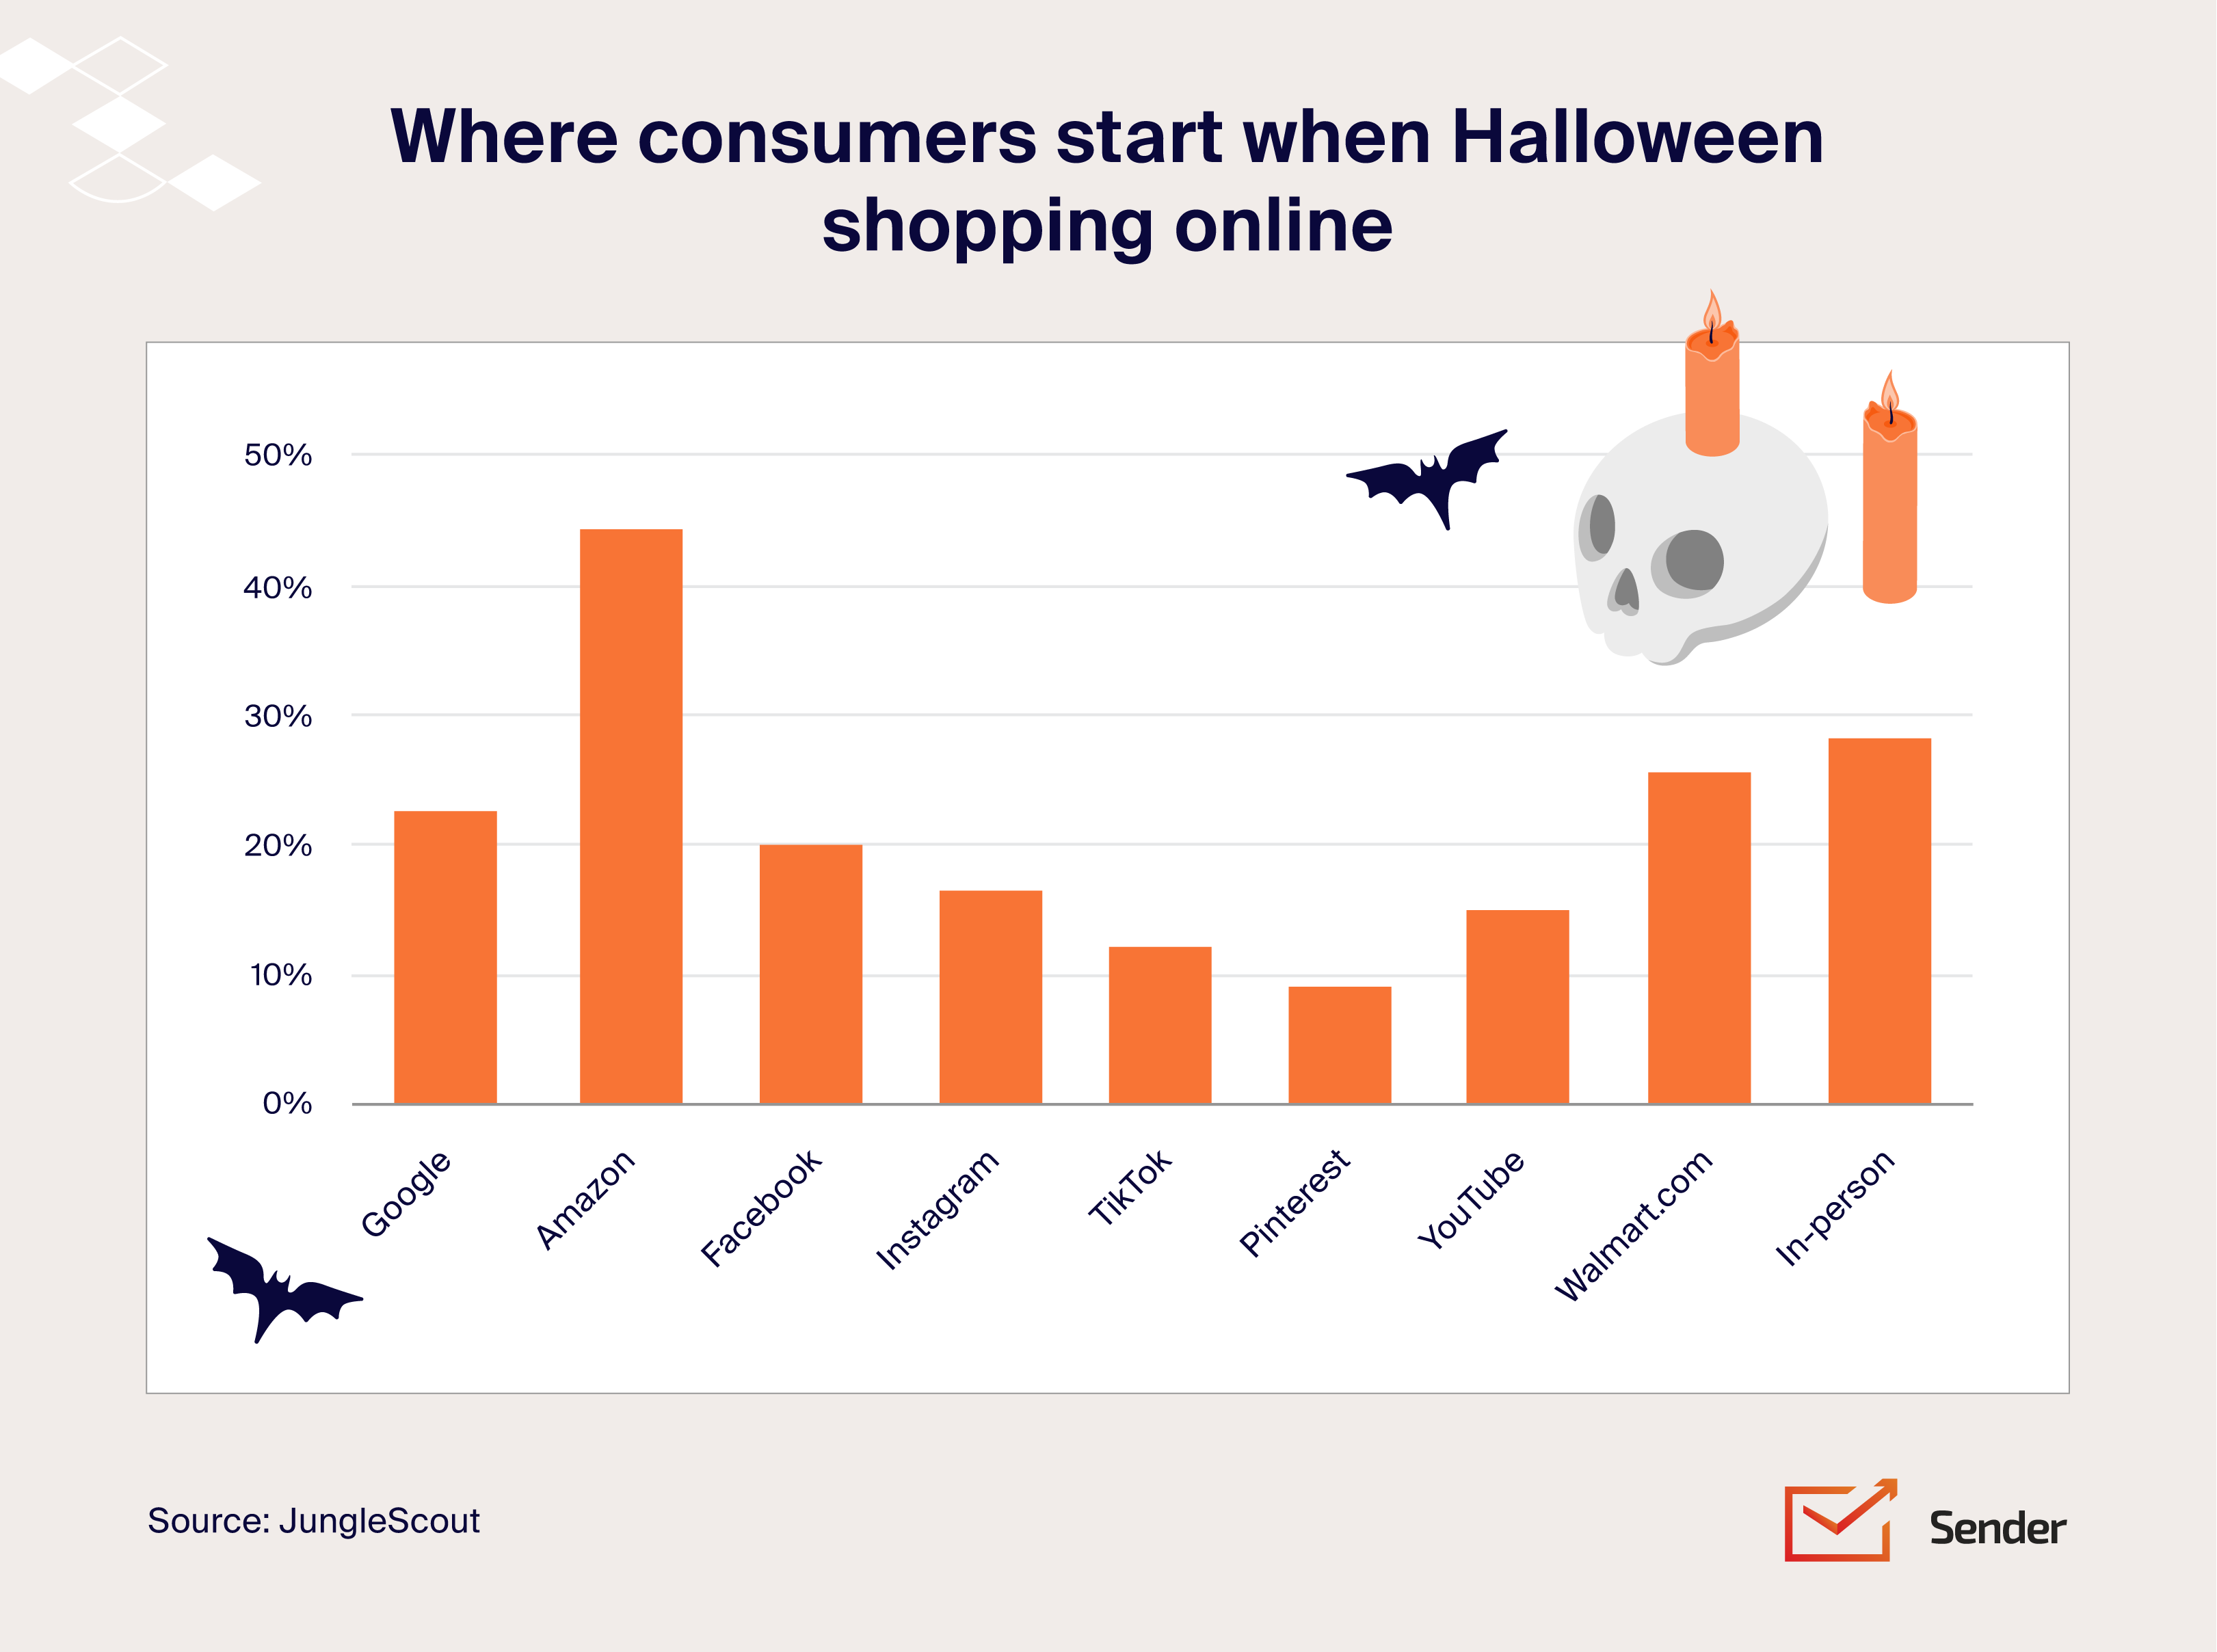
- 44% of consumers will go to Amazon to shop for Halloween-related items;
- 29% of Gen Z and millennials are moving from in-person shopping to online shopping.
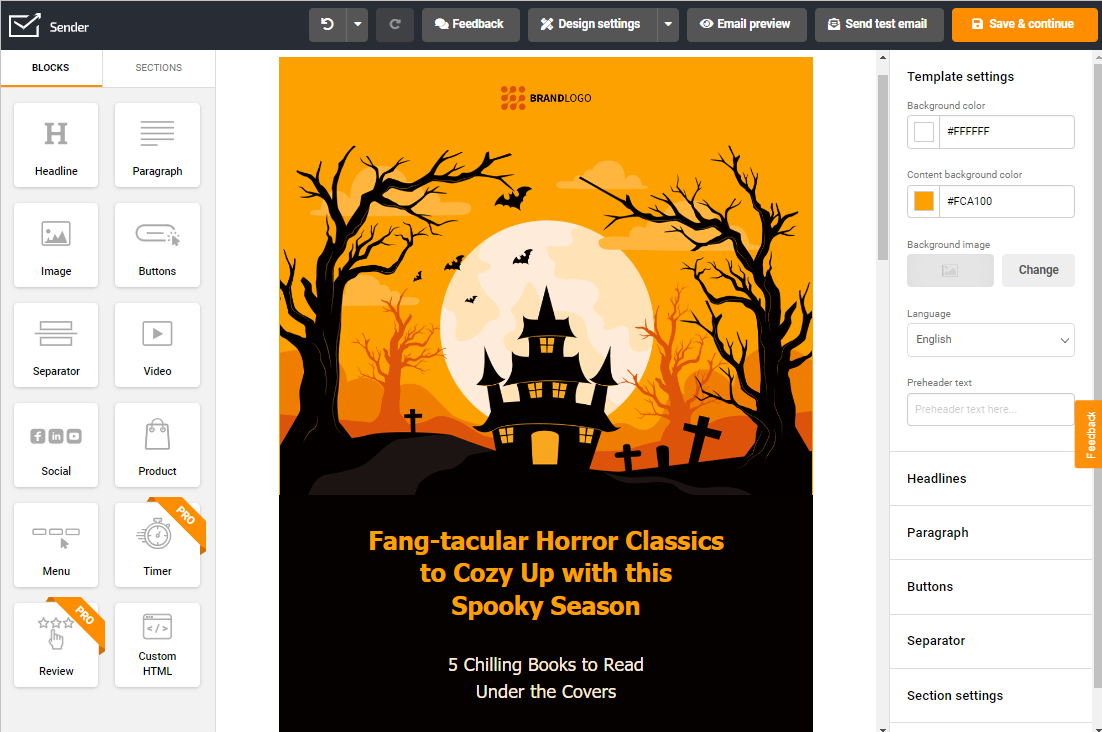
Promote your goods through email newsletters. With Sender — it’s easy, affordable and effective.
Sustainability Trends
Sustainability concerns have made their way into Halloween spending and celebrations. People are adopting ‘green’ initiatives during this time. Here’s the data:
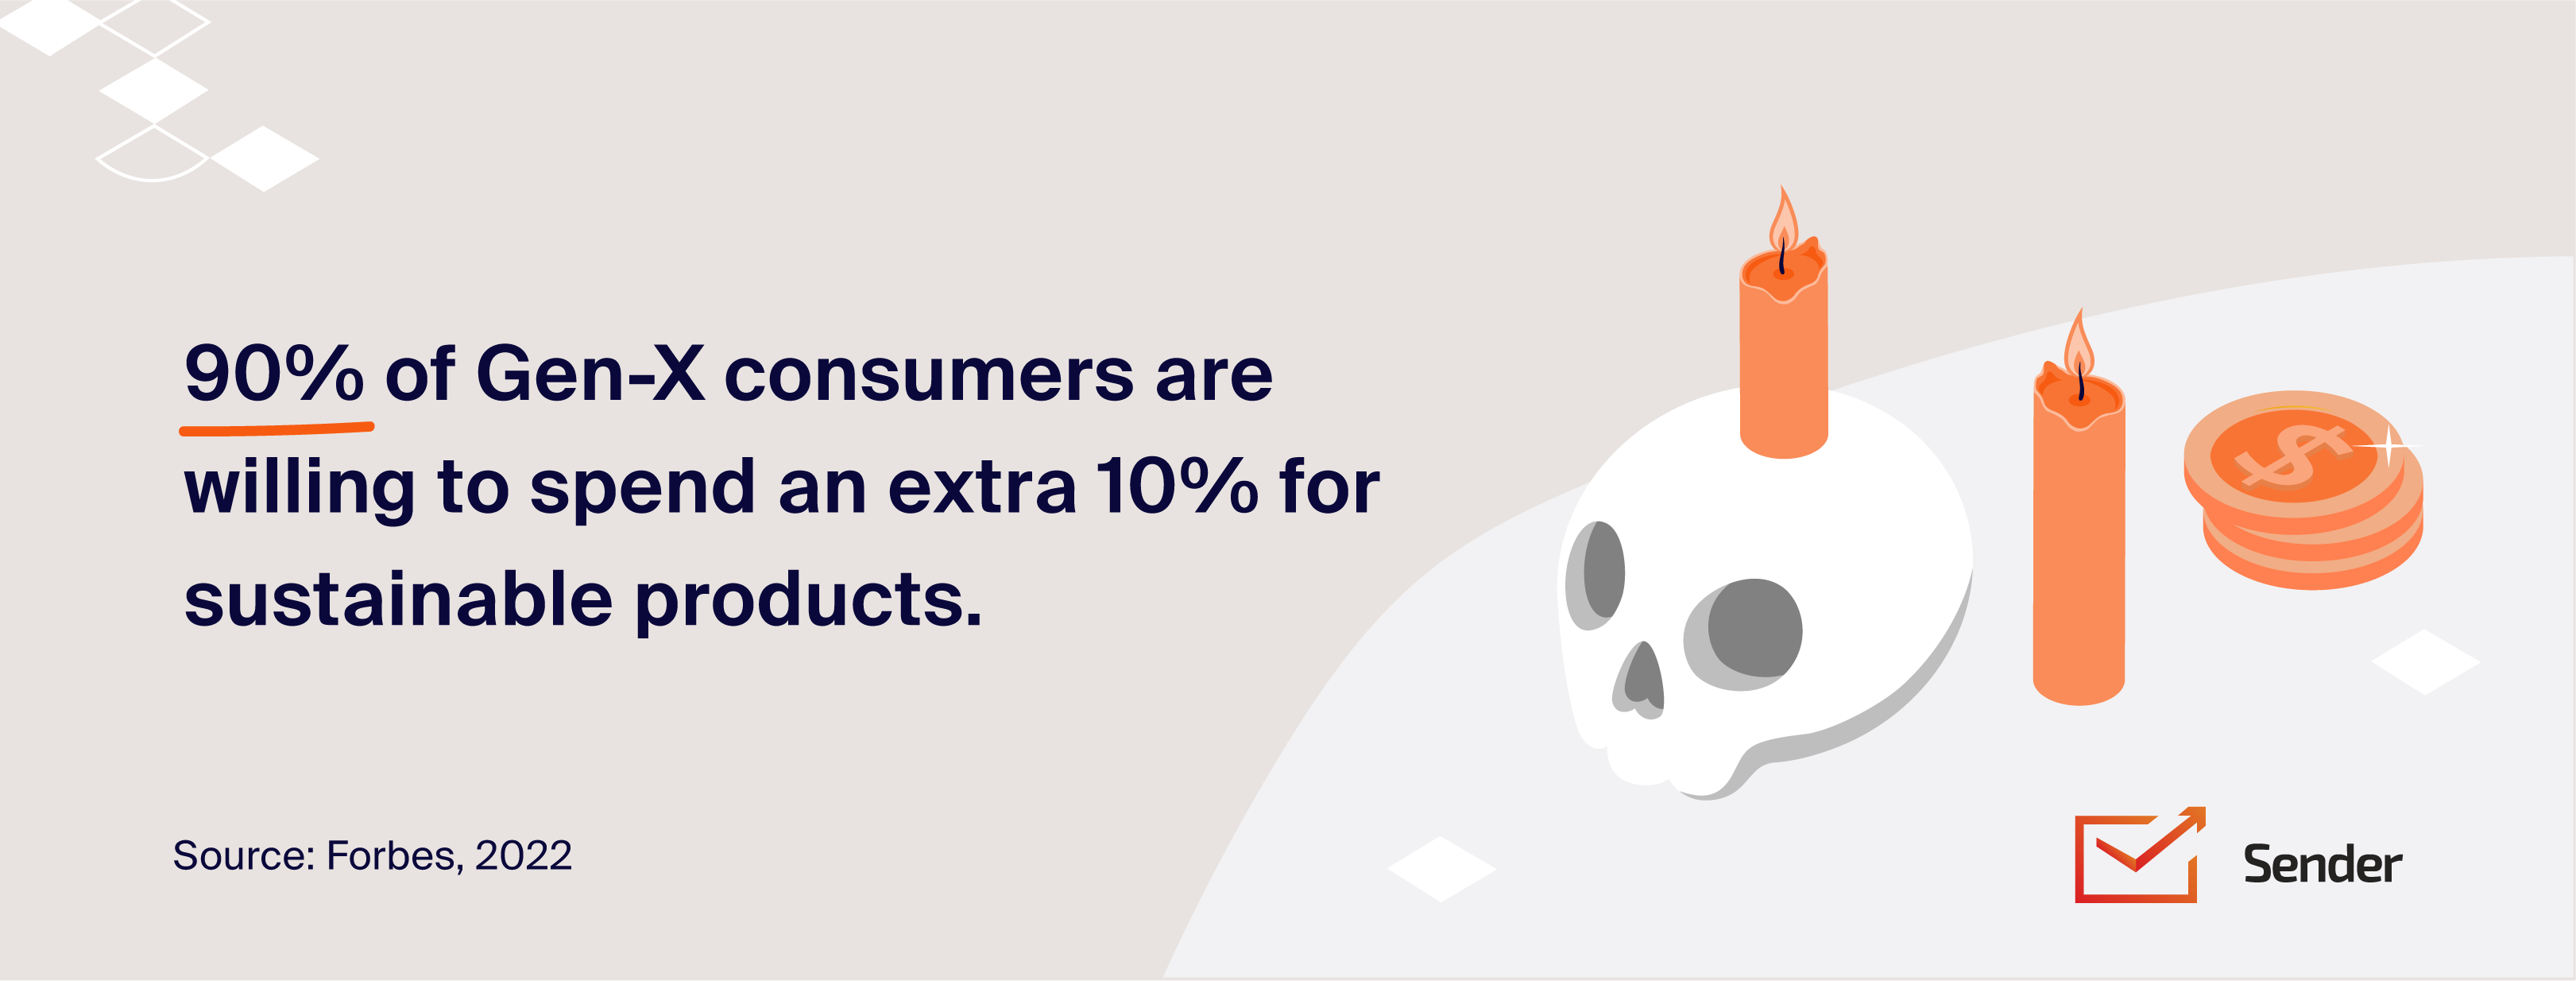
- 58% of consumers are willing to spend more on sustainable apparel/costume options;
- 57% of Americans celebrating Halloween in 2024 said they were considering DIY costumes and secondhand décor to save money;
- 20% of consumers consider sustainability in their Halloween purchases;
- 70% of American consumers took at least one cost-saving measure for Halloween in 2025, with reusing items from previous years being the most popular one.
If you enjoyed these statistics, check out some more that we’ve gathered on different topics:
- Valentine’s Day Statistics & Facts for 2026
- Abandoned Carts: Statistics, Reasons & Recovery Strategies
Halloween Statistics FAQs
What are Halloween shoppers spending the most money on?
Halloween shoppers spend the most on costumes, decorations, and candy. In 2025, spending is expected to reach $4.3 billion on costumes, $4.2 billion on decorations, and $3.9 billion on candy, making these the top Halloween purchase categories.
What percentage of American adults carve a pumpkin for Halloween?
According to the most recent NRF data, about 43% of American adults typically carve pumpkins for Halloween while kids are busy trick-or-treating. Most of them make jack-o-lanterns for their homes, which remains one of the most popular Halloween traditions.
How many Americans celebrate Halloween?
According to the NRF, 73% of American households will celebrate Halloween or participate in Halloween-related activities in 2026.
How has the marketing/advertising of Halloween costumes changed over the years?
Modern day Halloween costume marketing has evolved with social media and ecommerce. Influencer marketing for Halloween on Instagram and TikTok now shape costume trends. Pop culture references dominate campaigns, while brands also promote DIY and sustainable options. This shift reflects changing consumer preferences and digital shopping habits.
How much money is spent on Halloween in the US?
In 2025, approximately $13.1 billion was spent in the US on Halloween shopping, including costumes, decorations, candy, and greeting cards. In 2024, total Halloween spending reached about $11.6 billion across the same categories, while there are no Halloween advertising statistics to show how much is spent on marketing.
Also read:
- 40+ Landing Page Statistics with Industry Benchmarks
- 18 Hauntingly Good Halloween Emails & Subject Lines
- 65+ Online Advertising Statistics (Facts and Figures for 2026)
*Sources:
- https://medium.com/@marilena.tsesmeli/75-halloween-statistics-and-facts-every-retailer-should-consider-9ac45f790dee
- https://www.theshelf.com/the-blog/halloween-trends-halloween-marketing
- https://www.driveresearch.com/market-research-company-blog/2022-fun-sized-halloween-statistics
- https://www.statista.com/statistics/1269330/sources-of-inspiration-for-halloween-costumes-in-the-us
- https://www.wastemanaged.co.uk/our-news/halloween/halloween-waste
- https://greenly.earth/en-gb/blog/ecology-news/what-is-the-carbon-footprint-of-halloween
- https://www.inc.com/nick-hobson/20-years-of-starbucks-pumpkin-spice-latte-a-lesson-for-how-to-build-a-brand-within-a-brand.html
- https://nrf.com/media-center/press-releases/nearly-half-halloween-shoppers-start-purchasing-items-october
- https://nrf.com/media-center/press-releases/nrf-consumer-survey-finds-halloween-spending-to-reach-record-13-1-billion
- https://www.foodandwine.com/most-popular-halloween-candy-in-america-instacart-report-2025-11815120
- https://www.circana.com/post/no-bones-about-it-halloween-trends-show-up-across-multiple-categories-in-2025
- https://ktvz.com/stacker-lifestyle/2024/10/17/the-latest-halloween-trick-or-treat-trends-according-to-instacart-data/
- https://www.halloweencostumes.com/2025-halloween-survey.html
- https://licensinginternational.org/news/halloween-participation-returns-to-pre-pandemic-levels-with-record-spending-spider-man-is-top-costume/
- https://goodwillsp.org/news/halloween-survey-2024