


Your landing page defines the make-or-break moment in your digital marketing funnel. It converts visitors into valuable leads or customers. But how much impact do landing pages have on your sales funnel and revenue?
We’ve gathered relevant user engagement metrics and landing page stats to give you an idea. So, roll up your sleeves and start taking notes as we share top landing page trends and what matters the most.
General Landing Page Statistics
Are you always concerned about your landing page performance? Do you keep building multiple landing pages to test things out? Data can help you understand your business’s landing page ROI. Here are some vital statistics:
- Websites with more landing pages (10-15 pages) generate 55% more leads compared to websites with less than ten landing pages;
- Long landing pages have the potential to generate 220% more leads than shorter landing pages;
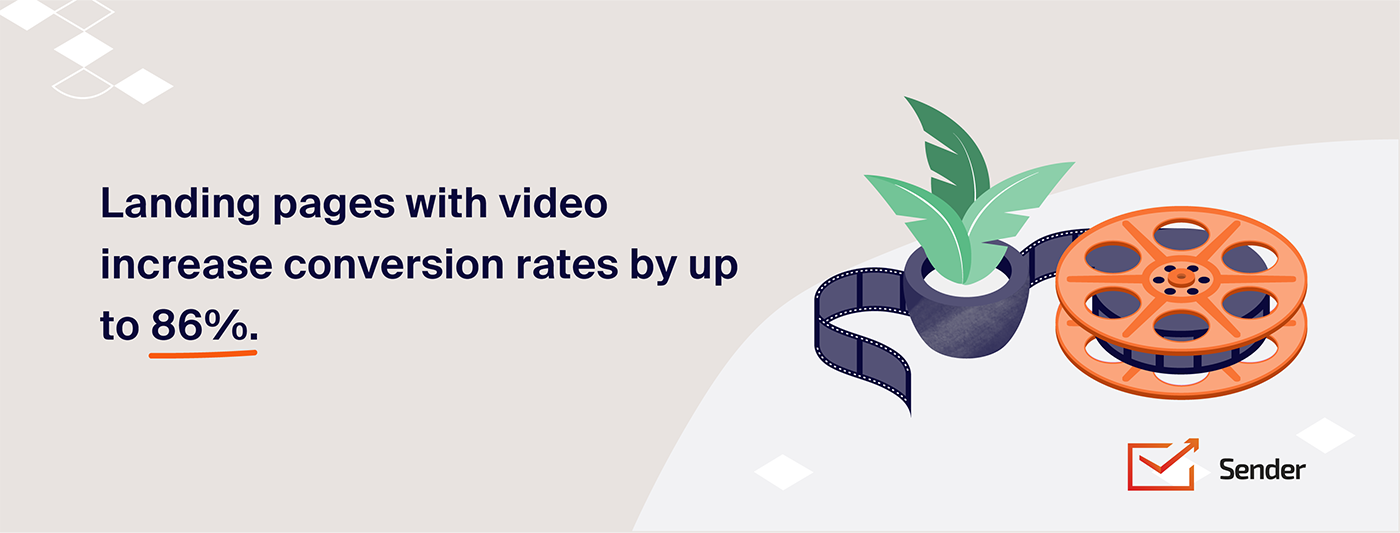
- Landing pages with video increase conversion rates by up to 86%;
- 48% of marketers create a new landing page for each marketing campaign.
Average Landing Page Conversion Rate
When it comes to landing page conversions, you’ve got to carefully sync different elements. Focused messaging, clear CTAs, and personalization are critical reasons for outstanding performance. Here’s the data to help you create landing pages that perform:
- The average landing page conversion rate is 7.12%;
- Personalized call-to-actions on landing pages improve performance by 202%, highlighting personalization effectiveness;
- Using the word ‘Submit’ as CTA can decrease conversion rates by 3%.
Good Landing Page Conversion Rate
When it comes to ideal landing page conversion rates, time to load, compelling copy, and visuals relevant to your target audience matter a lot. Here’s some insight to help you build your own landing pages:
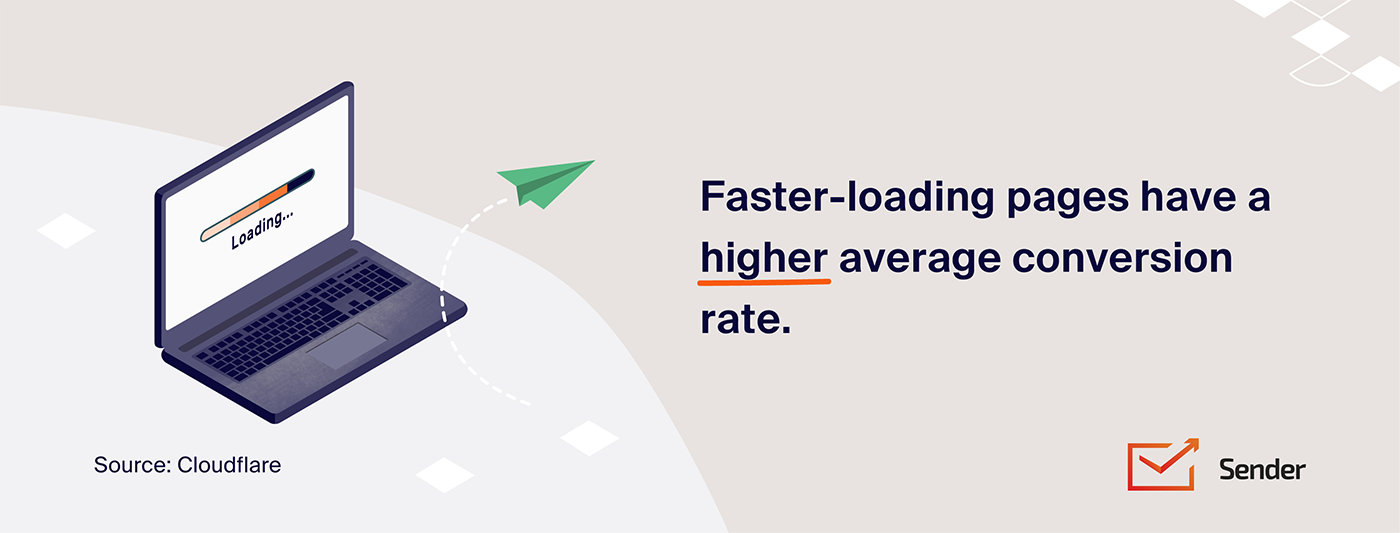
- Faster-loading pages have a higher average conversion rate;
- Pages loading within 2 seconds have a 9.6% conversion rate;
- Landing pages that load within 5 seconds have a 3.3% conversion rate.
Sales Page Conversion Rate
If you need lead generation metrics for landing page optimization, here’s some information that may help you in creating a high-converting sales page:
- Adding multiple offers on your landing page can reduce conversions by 266%;
- Landing or sales page sign-up forms have a 23% conversion rate;
- Reducing one field on a sales page form can increase conversions by up to 50%;
- The average conversion rate for ecommerce product pages is 2.86%;
- 10% of the top landing pages in ecommerce convert at 11.45% or higher.
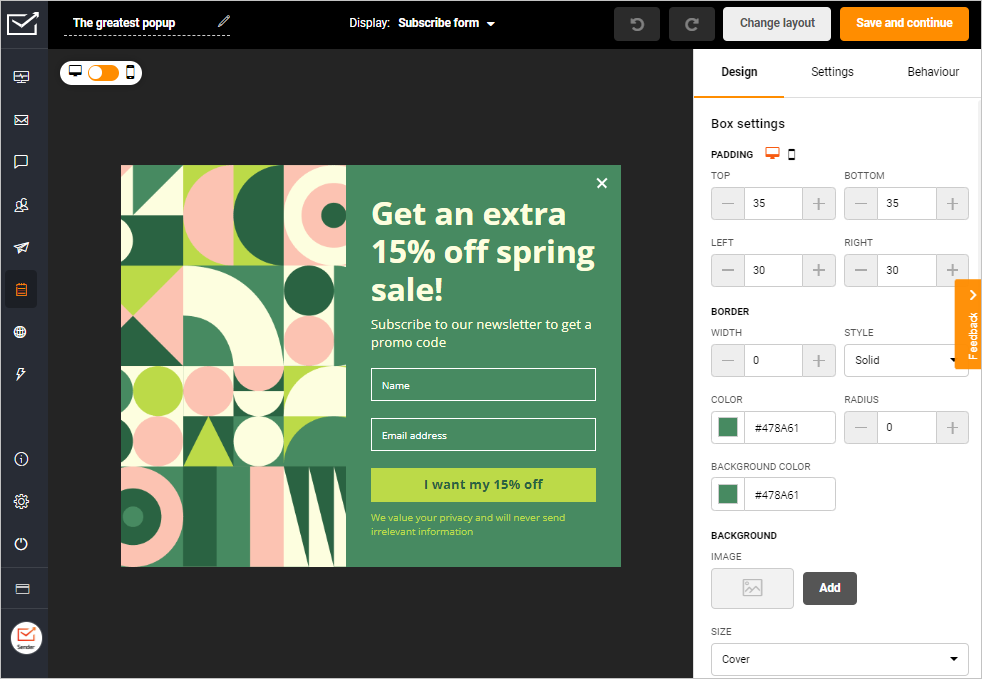
Use Sender to integrate a sign-up form into your landing page to capture quality leads and grow your contact list.
Landing Page Loading Time Statistics
Landing page load time has a direct impact on the conversion rates. Here’s the page load and bounce rate statistics you need to know:
- 47% of users expect landing pages to load within 2 seconds or less;
- A one-second delay in page load times may result in a 7% decrease in conversions;
- Average bounce rate for landing pages ranges between 60-90%;
- The likelihood of mobile visitors bouncing off increases by 123% when landing page load time increases from one second to 10 seconds.
A/B Testing in Optimizing Landing Pages
A good landing page builder gives A/B testing features for optimizing your pages and improve conversion rates. It involves running experiments between two variants to check which one performs better. Here are some statistics about A/B testing for landing pages:
- 70% of brands increase revenue from landing pages using A/B testing;
- Businesses can increase average revenue per user by up to 50% through A/B testing;
- Only 17% of marketers use A/B testing to increase conversion rates;
- Companies that improved conversion rates last year do 50% more tests than others;
- 44% of companies use A/B testing tools for running tests and analyzing A/B testing results.
Landing Pages Visual Content Statistics
A landing page’s design directly affects your page performance. Here are some design and usability metrics to understand the visual content impact on conversion rates:
- Using social proof on a landing page can increase conversion by up to 34%;
- Adding images on a landing page increases a person’s desire to read textual content by 80%;
- People prefer reading the value proposition on landing pages as bullet points;
- Red-colored CTA button can increase the conversion rate by 21%.
Mobile Responsiveness on Landing Pages
It’s a no-brainer that people want responsive landing pages. But how does it affect your landing page performance? Let’s look at some mobile landing page statistics:
- Only 50% of the landing pages are mobile-friendly;
- 53% of mobile visitors abandon a page if it takes longer than 3 seconds to load;
- Dynamic landing pages convert 25.2% more mobile users.
Webinar Landing Page Conversion Rate
Planning to use landing pages for webinars? We’ve got some insight on that, too:
- Webinar landing page conversion rate can be as high as 51%;
- Landing pages promoting webinars have an average conversion rate of 22.84%;
- Webinars with less than 200 attendees have a 50% conversion rate;
- 73% of marketers and sales professionals feel that webinars are the best way to generate quality leads;
- 62% of webinar attendees request a sales demo.
B2B Landing Page Conversion Rates
Do you need more landing page conversion benchmarks for your B2B business? Here are some insights on landing page conversion rate by industry, traffic-to-conversion ratios, and more.
- The average conversion rate for B2B landing pages is between 2-5%;
- 68% of B2B businesses use landing pages to generate leads;
- B2B companies with 40+ landing pages generate 12 times more leads than those with five or fewer.
Industry Benchmarks for Landing Page Performance
Looking for deeper industry conversion benchmarks about the performance of landing pages? We’ve compiled some interesting insights about conversion rates and search traffic based on digital marketing benchmarks by Unbounce:
- Paid search is the primary traffic source for SaaS landing pages, with about 46.4% share;
- A joyful and anticipatory tone in an ecommerce landing page copy increases the conversion rates;
- The business services industry has an average conversion rate of about 3.5%;
- Landing pages with a single clickable element perform best for the business services industry;
- Online and remote learning industry have conversion rates as high as 6.8%;
- Education landing pages get half of their traffic from paid ads on Google & Bing.
That’s all for now. Did any landing page statistic here shocked you? Here are some more articles you will love:
- 12 High Converting Landing Pages Examples & How to Build One
- 15 Must-See Product Landing Page Examples
- 8 Landing Page Examples PROVEN to Convert
Sources:
- https://blog.hubspot.com/blog/tabid/6307/bid/33756/Why-You-Yes-You-Need-to-Create-More-Landing-Pages.aspx
- https://marketingexperiments.com/copywriting/web-usability-long-landing-page
- https://www.smartinsights.com/conversion-optimisation/landing-page-optimisation/5-landing-page-trends-boost-conversions-2016-beyond/
- https://www.getresponse.com/resources/reports/email-marketing-benchmarks#landing-page-conversion-by-industry
- https://blog.hubspot.com/marketing/personalized-calls-to-action-convert-better-data
- https://unbounce.com/conversion-rate-optimization/how-to-optimize-contact-forms/
- https://www.thinkwithgoogle.com/consumer-insights/consumer-trends/mobile-page-speed-new-industry-benchmarks/
- https://techjury.net/blog/landing-page-statistics/
- https://www.quicksprout.com/contact-form-conversion-rate/
- https://www.cloudflare.com/learning/performance/more/website-performance-conversion-rates/
- https://web.dev/learn/performance/why-speed-matters
- https://www.wordstream.com/blog/ws/2017/08/02/conversion-rate-statistics
- https://www.customedialabs.com/blog/bounce-rates/
- https://www.thinkwithgoogle.com/marketing-strategies/app-and-mobile/mobile-page-speed-new-industry-benchmarks-load-time-vs-bounce/
- https://www.portent.com/blog/analytics/research-site-speed-hurting-everyones-revenue.htm
- https://business.adobe.com/blog/basics/learn-about-a-b-testing
- https://www.hubspot.com/marketing-statistics
- https://econsultancy.com/reports/conversion-rate-optimization-report
- https://www.invespcro.com/blog/the-state-of-ab-testing/
- https://unbounce.com/landing-page-examples/high-converting-landing-pages/
- https://www.office.xerox.com/latest/COLFS-02UA.PDF
- https://promo.com/blog/does-video-increase-conversion-rate
- https://speero.com/post/the-presentation-of-your-value-proposition-matters-original-research
- https://cxl.com/blog/which-color-converts-the-best/
- https://www.merkleinc.com/emea/blog/dynamic-landing-pages-relevance-made-easy
- https://www.ruleranalytics.com/blog/insight/conversion-rate-by-industry/
- https://unbounce.com/conversion-benchmark-report/
- https://luisazhou.com/blog/webinar-statistics