


Imagine spending countless hours crafting a perfect email. You create a compelling design, magnetic headline, and then… Silence.
Here’s a hard truth: email marketing success isn’t just about sending emails. It also includes using the right metrics to track your success rate.
We’ve helped hundreds of marketers turn their campaigns around by focusing on the right factors. So now we’ll distill the must-know email marketing metrics and show you how to use them to fine-tune your strategy and drive results.
Let’s get started.
This article is part of our Email marketing guide.
What are Email Marketing Metrics?
Email marketing metrics are crucial data points that show how well your email campaigns connect with your audience. They reveal how recipients complete key actions like clicks, purchases, and sign-ups.
Metrics come in two main categories:
- Engagement metrics, such as open and click-through rates, show how appealing your content is to your audience;
- Conversion metrics like revenue per email and conversion rate, measure the direct impact on business goals.
Success in email marketing comes from testing and analyzing these metrics with your unique audience. Every campaign is a chance to learn, so focus on continuous improvement and adapt as you go.
Importance of Email Marketing Metric Monitoring
Tracking email marketing metrics takes the guesswork out of reaching your target audience and helps you create relevant messages that connect.
Insights from marketing metrics help you to:
- Write engaging copy that builds stronger connections with your readers;
- Send personalized, relevant content that aligns with recipient interests;
- Track deliverability trends to maintain a strong sender reputation;
- Measure return on investment (ROI) by monitoring conversions and revenue;
- Refine your email design and strategy to boost engagement.
If you’re already a Sender customer, our walkthrough on viewing campaign analytics in Sender covers exactly where each of these metrics lives in the dashboard.
Create email newsletters and see all of your email marketing metrics on the same dashboard with Sender.
General Email Marketing Metrics
There are dozens of email marketing metrics, but rather than overwhelming you with information, let’s concentrate on the really important ones.
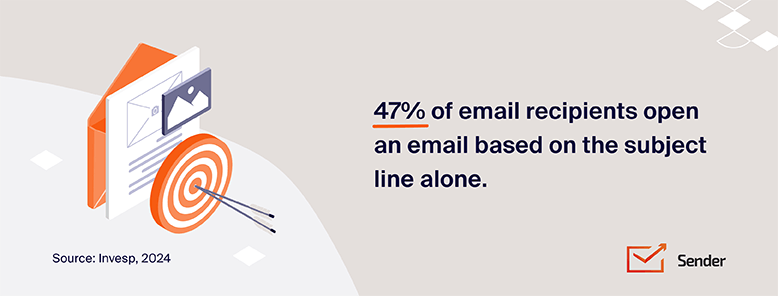
Open Rate Metric
Open rate measures the percentage of recipients who opened a specific email. It’s calculated as:
Email Open Rate = (Unique email opens ÷ (Total emails sent – Bounced emails)) × 100
A higher open rate means your emails are compelling and relevant to your subscribers — and email open rate benchmarks across industries vary widely. Make this your first email marketing priority.
You can improve open rates in your email marketing strategy by:
- Crafting relevant subject lines that spark curiosity or urgency;
- Segmenting your audience to ensure emails are personalized;
- Optimizing send times based on audience activity patterns.
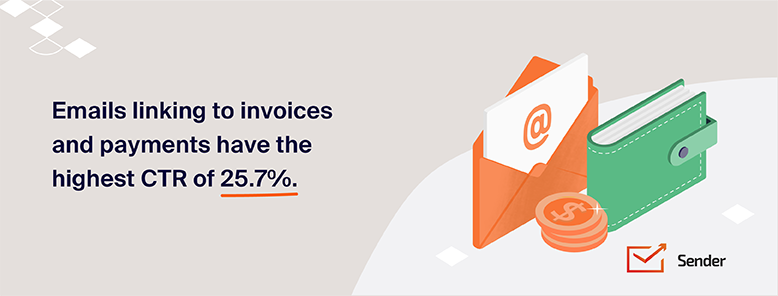
Click-Through Rate (CTR)
Click-through rate measures the percentage of people who take action on an ad or link after seeing it.
CTR = (Number of clicks ÷ Total impressions) × 100
A higher CTR indicates effective targeting and strong engagement.
Ways to improve CTR:
- Craft clear, compelling calls-to-action (CTAs) that encourage clicks;
- Personalize your emails with tailored content for different audience segments;
- Incorporate visually engaging elements, like images or videos, to attract attention.
Improving CTR is crucial for boosting engagement. It’s proven especially beneficial when running an ecommerce business, where a well-targeted campaign can drive more visits, increase sales, and build a stronger customer base.
Click-To-Open Rate (CTOR)
Click-to-open rate (CTOR) measures the percentage of recipients who click a link after opening an email.
CTOR = (Unique link clicks ÷ Unique opens) × 100
A higher CTOR shows stronger engagement for every email opened.
A good CTOR is typically between 15-30%.
Mailchimp
How to improve CTOR:
- Tailor email subject lines, greetings, and content to the reader’s preferences and past behavior;
- Send more targeted messages by grouping contacts by interests or engagement level;
- Use clear, direct language that encourages clicks and stands out visually.
Unsubscribe Rate
The unsubscribe rate measures the percentage of email recipients who’ve opted out of your email list.
Unsubscribe rate = (Number of unsubscribes ÷ Total emails sent) × 100
A high unsubscribe rate signals your emails may not align with recipient expectations, content interests, or frequency preferences.
A good unsubscribe rate is generally considered to be below 0.5%
Optinmonster, 2024
How to improve your unsubscribe rate:
- Segment your email list to deliver more targeted content;
- Maintain a consistent but not overwhelming email frequency;
- Allow subscribers to customize their email preferences.
Spam Complaint Rate (SCR)
The spam complaint rate shows the percentage of emails delivered that are flagged as spam. It indicates issues with email deliverability and sender reputation.
Spam complaint rate = (Spam complaints ÷ Total emails delivered) × 100
High spam complaint rates can damage your credibility, leading to potential blacklisting by your email service provider, and reduced email deliverability.
A high spam complaint rate can affect your email deliverability rate. Keep it below 0.1% Source
ActiveCampaign, 2024
How to improve SCR:
- Use double opt-in methods to ensure genuine subscriber consent;
- Provide clear and visible unsubscribe options in every email;
- Segment your email list to deliver more relevant content.
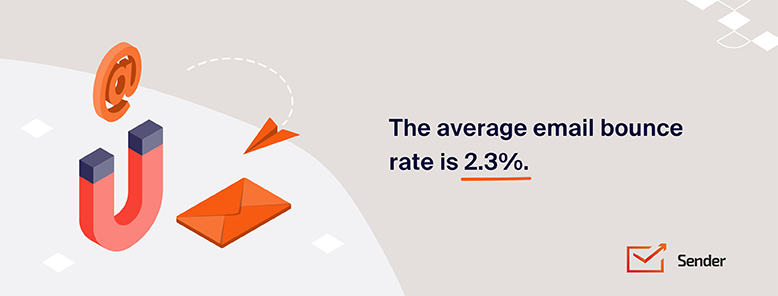
Bounce Rate
The bounce rate tells you how many emails couldn’t be delivered to recipients. Bounces can be categorized as:
Soft Bounce
A soft bounce happens when an email can’t be delivered right away. This could be because the recipient’s inbox is full, the server is temporarily down, or the email is too large to go through.
A soft bounce indicates a minor, temporary issue that’s not a big deal, especially if it’s occasional.
Hard Bounce
A hard bounce happens when an email can’t be delivered. This usually means the email address is invalid, the domain doesn’t exist, or the server has blocked the message.
Hard bounces indicate a major issue with the recipient’s email address, which may suggest outdated or inaccurate data. High hard bounces could lead emails to the junk or spam folder and, in severe cases, cause the sender to be blacklisted.
Bounce rate = (Soft bounces + Hard bounces) ÷ Total emails sent) × 100
Keeping bounce rates low means a cleaner email list, a good standing with service providers, and minimal spam complaints.
Tips to improve bounce rate:
- Use double opt-in during signup to confirm email accuracy and minimize spam complaints;
- Monitor and remove hard-bounce email addresses from your marketing lists;
- Use reputable email service providers with good deliverability rates.
Email List Growth Rate
The email list growth rate tracks how quickly an organization grows its email audience. It can be calculated over monthly or quarterly periods.
Email list growth rate = (Net increase in subscribers ÷ Initial number of subscribers) × 100
A positive growth rate indicates effective email marketing strategies, increasing potential reach, and engagement opportunities.
Email marketing has one of the highest ROIs, but you need a quality email list to truly capitalize on it.
Demand Curve, 2022
How to grow your email marketing list:
- Implement lead magnets like free eBooks, webinars, or exclusive content;
- Leverage social media promotion and paid advertising to drive subscriptions;
- Create targeted landing pages specifically designed to capture email addresses.
Email Sharing/Forwarding Rate
The email sharing/forwarding rate measures the percentage of recipients who share or forward an email to others.
Email sharing/forwarding rate = (Number of shares or forwards ÷ Total emails delivered) × 100
A higher rate suggests your audience finds it valuable enough to share with their network.
A high email forwarding rate suggests that your content resonates well with your audience.
NotifyVisitors, 2023
How to improve email sharing/forwarding:
- Create valuable, share-worthy content that resonates with your audience;
- Add a clear “Forward to a Friend” link in your emails;
- Use social proof elements like “Already shared by X people” to encourage more forwards.
Advanced Email Marketing Metrics
Now that we’ve covered the basics, it’s time to level up. In this chapter, we’ll dive into more advanced metrics that go beyond the surface and help you truly measure the impact of your campaigns.
Email Read Rate or Read Time
Email read rate measures the meaningful amount of time (at least 8 seconds) the reader spends reading your email after opening it.
Email read rate = (Number of Emails Read ÷ Unique Email Opens) × 100
A high read rate means that the subscribers find the email valuable, which can lead to higher engagement and conversion rates over time.
The power of email marketing is in the consistent touchpoints. The more you engage, the more trust you build.
Russell Brunson, Co-founder of ClickFunnels
How to improve email read time:
- Test sending times based on your audience’s peak engagement periods;
- Personalize the email content to make it more relevant to the reader;
- Use a clear subject line, short paragraphs, and bullet points to improve scanning and encourage deeper reading.
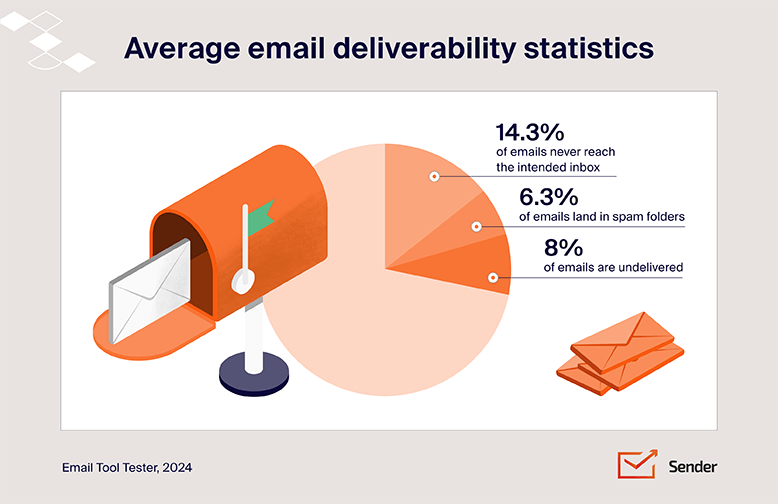
Email Deliverability
Email deliverability measures how successfully your emails hit the recipient’s inbox without being filtered as spam.
Deliverability = ((Total emails sent – Bounced emails) / Total emails sent) × 100
Higher deliverability strengthens the sender’s reputation, drives ROI, and improves engagement and conversion rate.
How to improve emails delivered:
- Implement double opt-in for better subscriber authenticity;
- Use authentication protocols (SPF, DKIM, DMARC) to verify your sending identity;
- Follow best email practices like appropriate text-to-image ratio, clear unsubscribe option, and proper formatting.
Authentication and formatting are the floor — for the next level, see our deeper guide on how to improve email deliverability beyond the basics.
Conversion Rate (CVR)
Conversion rate is the percentage of visitors who take a desired action on your website (such as signing up for a newsletter or making a purchase).
CVR = (Number of conversions ÷ Total number of visitors) × 100
A higher CVR means more customers are taking action.
Your conversion rate is the most telling indicator of effective marketing campaigns.
Instantly, 2024
Tips to improve CVR:
- Implement A/B testing on key elements like headlines, CTAs, and form fields;
- Simplify your forms and checkout process – reducing form fields to under 5 can increase conversions by 120%;
- Invest in a well-designed website, as a professional design can increase conversion rates by up to 200%.
Pro Tip: If you’re just starting out, learning to create a website with modern design principles can greatly impact conversions.
Whether you’re sending users to a landing page or a full website for a small business, the key is to simplify the user experience. Clear, easy-to-navigate websites help ensure more visitors complete desired actions, which can boost your email marketing conversion rate significantly.
Revenue per Email (RPE)
Revenue per email measures the financial impact of email campaigns.
RPE = (Total revenue from campaign ÷ Total emails sent)
A high revenue per email indicates that your email campaigns generate significant revenue per email.
Marketers can directly link their email strategy to revenue performance, which helps allocate resources to the most profitable campaigns.

Tips to improve revenue per email:
- Use subscriber data to create personalized recommendations and messaging;
- Segment subscribers by behavior, preferences, or demographics to tailor content;
- Perform an A/B split test on subject lines and CTAs to get the best combinations.
Engagement Over Time
Engagement over time measures how users interact with your email campaign across different time periods.
EOT = (Total interactions during period ÷ Total users during period) × 100
A low EOT might suggest it’s time to adjust your content or engagement strategies to better connect with your audience.
Tracking engagement over time allows businesses to meet the evolving preferences of their target audience.
Optinmonster, 2025
How to improve EOT:
- Implement a consistent posting schedule based on your audience’s peak activity times;
- Diversify your content mix with educational, promotional, and interactive content;
- Use automation tools to maintain regular engagement during off-hours.
Day of Week Performance
Day of week performance shows when your audience will most likely engage with your email campaign.
It’s typically calculated using three key metrics:
- Daily open rate = (Number of opens on day X ÷ Total emails sent on day X) × 100
- Daily click rate = (Number of clicks on day X ÷ Total emails sent on day X) × 100
- Daily conversion rate = (Number of conversions on day X ÷ Total emails sent on day X) × 100
By tracking open rates, clicks, and conversions across different days, you can time your content to reach users when they’re most responsive to your email marketing.
Fridays yield the highest open rates at almost 19%.
Sender.net
Tips to improve DOW performance in an email marketing campaign:
- Monitor and analyze metrics for 8-12 weeks to identify clear patterns;
- Research industry benchmarks to avoid days when competitors might also send emails;
- Send emails during high-engagement windows, like late morning or early afternoon.
Email Marketing Campaigns ROI metrics
Understanding email metrics is key to running successful campaigns. Real-time campaign reports built around these metrics turn the numbers into decisions instead of dashboards. Here are the ROI metrics you’ll need to know:
Revenue per Subscriber (RPS)
Revenue per subscriber gauges how much each subscriber brings to your business over time.
RPS = Total email-generated revenue ÷ Number of active subscribers
Tracking this metric helps you create a data-driven email marketing campaign to convert more subscribers for long-term profitability.
Analysis of US merchants found an average annual revenue of $6.86 per subscribed account.
Luisa Zhou
How to improve RPS:
- Tailor content and offers to individual subscriber preferences;
- Provide clear and compelling calls-to-action (CTAs) that drive subscribers towards specific actions;
- Set up automated email sequences, such as abandoned cart flows, to engage/re-engage subscribers.
Subscriber Lifetime Value (LTV)
Subscriber lifetime value measures the total revenue a business anticipates from a subscriber for the entire time they engage with the brand.
LTV = Average revenue per subscriber per month × Average subscription length (in months)
Your LTV value shows the term worth of each subscriber and justifies the cost of acquiring new ones.
Understanding your LTV means long-term business sustainability.
EcommerceBonsai
How to improve LTV?
- Send relevant and targeted messages to drive repeat purchases;
- Encourage cross-selling and upselling to increase the value of each transaction;
- Use automation to build brand loyalty and encourage quicker purchases.
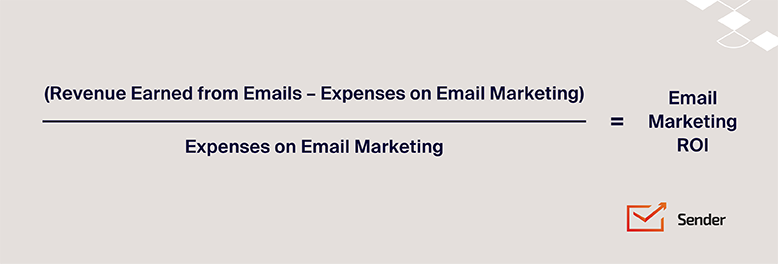
Return on Investment (ROI)
Return on investment evaluates the profitability of an investment by comparing the benefit it generates to its cost — for email marketing ROI calculated end-to-end with the full step-by-step framework, see our standalone guide
ROI = (Net return / Total investment) × 100
ROI is one of the key email marketing metrics that reveals whether campaigns are profitable or need automation.
Sending 9-16 emails per month yielded the highest email ROI.
Luisa Zhou, 2024
How to improve ROI:
- Implement detailed tracking to measure all marketing costs and returns across all channels;
- Focus on customer lifetime value (CLV) by developing strong retention and upselling strategies;
- Automate workflows for lead nurturing and customer follow-ups.
Metrics are the diagnostic layer, not the strategy itself. They tell you what’s working and what’s not — but the email marketing strategy these metrics serve is what determines whether you’re measuring the right things in the first place.