


Why do companies send hundreds of emails every year? Simple: it generates a staggering ROI of 3600%.
As email marketing service providers, we always stay curious about the impact of our work. So, we thought, why not curate the latest email marketing trends and statistics to see how email affects businesses globally.
Let’s look at these email marketing stats one by one.
This article is part of our Email marketing guide.
Top Email Marketing Statistics at a Glance
Email remains one of the most widely used digital communication channels and a key driver of marketing performance worldwide. The following email marketing stats highlight the scale of global email usage and its impact on engagement and revenue.
- 376.4 billion emails were sent and received daily worldwide in 2025, up from 361.6 billion in 2024;
- The number of email users is projected to reach 4.7 billion in 2026, growing further to 4.84 billion by 2027;
- Email marketing delivers one of the highest returns among digital channels, with around $36 earned for every $1 spent;
- 77% of marketers report that email engagement increased over the past year;
- 43.5% of email opens occur on mobile devices, highlighting the importance of mobile-friendly emails;
- Segmented email campaigns generate 30% more opens and 50% more click-throughs than non-segmented campaigns;
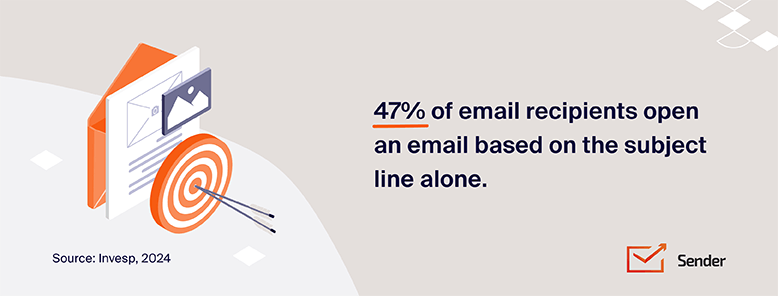
- 47% of recipients open emails based solely on the subject line, while 69% report emails as spam for the same reason;
- Abandoned cart emails convert three times more often than other automated email messages.
Global Email Usage Data
If you want to understand how widely email is used around the world, the latest statistics provide valuable insight into global adoption and usage trends. The figures below highlight how many people currently use email, how usage continues to grow, and how it compares across different regions and demographics.
Email Marketing Growth Rate and Market Expansion
- The number of email users worldwide is set to cross 4.7 billion in 2026, a 17.5% increase from 2020;
- Personal users have multiple email accounts, with an average user having 1.86 accounts in 2022;
- Apple Mail is the most popular email client worldwide with 58% market share, followed by Gmail (29%). Combined, Apple and Google control nearly 90% of the whole email market.
Global email volume statistics
- Nearly 10 billion emails are sent daily in the US (2025), making it the leading country. Germany and Ireland follow, each with roughly 8.5 billion emails per day;
- Generation Z leads all age groups in sending emails via smartphones, with about 67% using their phones for email;
- Around 376.4 billion emails were sent and received each day worldwide in 2025, an increase from 361.6 billion in 2024;
- Roughly 241 million spam emails are sent every minute (as of 2025), making up about 45.6% of total email traffic.
Market Size
- The global email marketing market was valued at approximately USD 13.2 billion in 2024;
- Market forecasts indicate that the global email marketing industry could reach a value of USD 36.3 billion by 2033.
Popular Email Marketing Statistics
Almost every marketer is curious about email marketing performance metrics.They want to know open rates for email campaigns along with some other KPIs.
But what’s a comparison metric for performance? Our breakdown of email marketing metrics and KPIs covers what to track and why — below are the numbers to peg your performance against.
Email Marketing Campaign Statistics
Before we dig deeper into specific performance metrics, here are some general statistics in favor of email marketing.
- The email marketing adoption rate remains high, with the email marketing market size being $6.13 billion in 2024 and predicted to grow to $17.9 billion by 2027.*
- 41% of marketers admit that email is their most effective marketing channel.*
- 77% of marketers have reported an increase in email engagement in the last 12 months.*
- 81% of small and medium business professionals believe that email marketing increases customer retention and helps acquire customers.*
Email Engagement Statistics
Email marketing is effective in engaging your audience and driving revenue. Here are some newsletter engagement metrics that support the statement:
- Average email deliverability is at 81%, with abandoned cart email success rates at the highest, converting 3 times more than other automated emails.*
- Mobile devices account for 43.5% of all email opens.*
- Personalized emails achieve 44.30% open rates vs non-personalized.*
- Using machine learning for subject line optimization can increase open rates by 26%
- The average open rate across various industries shows variation, with faith-based organizations leading at 44.11% and technology services at the lower end at 18.34%.

Email User Behavior Statistics
How do your email subscribers behave when reading and engaging with emails? We’ve got some answers. Have a look at some data sets revealing everyday subscriber engagement:
- 61% of all emails are read for 8 seconds or more. Almost a quarter (23.5%) of all emails get skimmed (an engagement of 2-8 seconds), and 15% of all messages get less than 2 seconds of their readers’ attention.*
- 28% of email users check their email inbox more than 10 times a day, and 4% – less than daily. Overall, 65% of respondents noted checking their email more than 3 times daily.*
- 77% of users report boredom as the main reason for checking emails.*
- 70% check their email in bed, and almost as many as the people who check after waking up.*
- The average time spent reading an email in 2025 is around 10 seconds, with over 30% of emails viewed for less than 2 seconds.*

Open Rate Statistics
When evaluating the success of any email marketing campaign, the first question is: ‘How many people opened the email?’ For email open rate benchmarks broken down by industry and sender type, see our deeper analysis.
Below are the headline numbers:
- 47% of email recipients open an email based on the subject line alone, and 69% of email recipients report email as spam based solely on the subject line.*
- Emails with preheaders get an open rate of 32.95%. Personalized email marketing campaigns have an open rate of 30.26%.*
- Out of the three types of email, automated emails stand second behind transactional emails for unique open rates (41%), click rates (13%), and click-to-open rates (24%).*
Open Rates by Industry
| Industry | Open Rate | Click Rate | Bounce Rate |
| Education | 45.32% | 2.26% | 1.35% |
| Ecommerce | 31.08% | 1.19% | 1.37% |
| Restaurant | 43.69% | 1.13% | 0.37% |
| Beauty and personal care | 39.81% | 1.46% | 0.26% |
| Real Estate | 40.00% | 1.14% | 0.97% |
| Retail | 37.50% | 1.50% | 1.57% |
| Software and web app | 38.14% | 2.04% | 1.85% |
| Non-profit | 53.21% | 3.25% | 1.20% |
Click-Through Rate Statistics
The click-through rate (CTR) tells how many people clicked any of the links within your email. If you’re serious about link clicks, here are some statistics:
- Internet marketing has the lowest average click-through rate (CTR) at 1.68%.*
- Communications as an industry has the highest average CTR at 5.77%.*
- Average cold email response rates generally hover between 1% and 10%.*
- Emails linking to invoices and payments had the highest CTR at 25.7%. Link to a resource, such as a blog, had a CTR of 6.7%. Both links to offer and link to poll stood at 2.8%.*
- Average CTR across all industries is 2.03%.
Click-through Rate by Email Type
| Type of Email | Click-through Rate |
| Triggered emails | 3.69% |
| Autoresponder emails | 4.26% |
| Newsletters | 2.13% |
| RSS emails | 7.24% |
Email Conversion Rate Statistics
Marketing professionals like us are mostly interested in conversions for evaluating a channel’s success. Let’s see what the data has to say about email conversion rates:
- In 2025, the average email conversion rate was 2.6%.*
- Abandoned cart emails convert 3x more than other automated emails.*
You can reach these numbers too — with Sender, it’s easy and affordable.
Email Marketing ROI and Financial Impact
ROI tells us how our email marketing efforts are impacting the bottom line. Let’s look at some statistics about email marketing revenue and how it is one of the most rewarding marketing channels.
Email Marketing ROI Statistics in 2026
The first email campaign, sent in 1978, generated $13 million in sales. Since then, companies have been enjoying great returns from email marketing campaigns. Here are some numbers about email marketing ROI:
- Email marketing ROI ranges from $36 for every $1 spent.*
- 18% of companies generate $70 in revenue for every 1 dollar spent.*
- 59% of marketers believe email is twice as effective in generating leads than other mediums like social media and PPC.*
- Email marketing acquires 40 times more customers than Meta & X.com combined.*
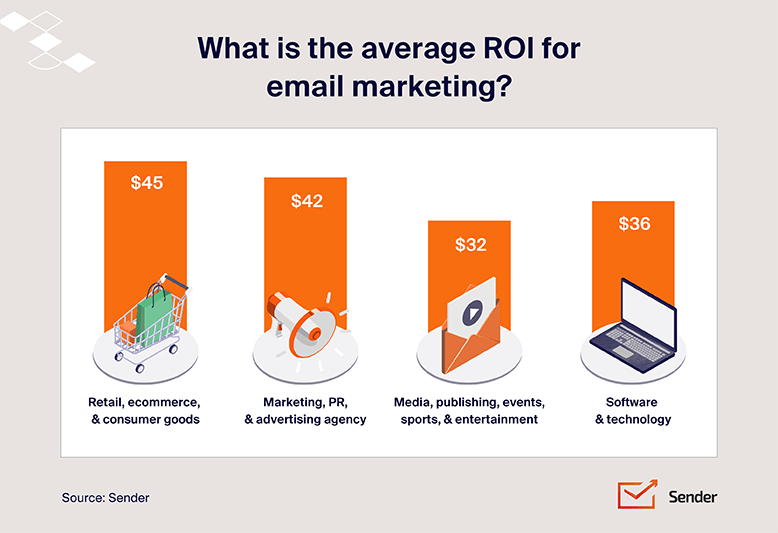
What is the Average ROI for Email Marketing?
ROI (Return on Investment) is one of the most talked about email marketing metrics out there. According to research, email marketing offers an ROI of up to 3600% . However, it may vary based on the industry you work in.
Here’s the marketing channel ROI comparison across some industries.
Email Marketing Content and Design Stats
Email is a popular channel to distribute content globally. It helps communicate directly with your audience. However, success depends on the way you write and design your emails.
Let’s look at some statistics highlighting the impact of email visuals on engagement.
Email Design and Content Statistics
If you’re curious about how you should design your next marketing campaign, here are some trends and numbers, including email subject line statistics, to guide your decisions.
- Using personalization in an email may lead to a 28.57% increase in click-throughs (2.7% rate with tailored content vs. 2.1% without).*
- Email is the third-highest owned media platform B2B marketers used to distribute content in the past 12 months.*
- Shorter subject lines (under 70 characters) have the highest open rates.*
- 6-word subject lines are optimal, but 2-4 word subject lines perform the best.*
- 33% of people are attracted to email subject lines with emojis, compared to 9% who prefer subject lines without emojis.*
- Subject lines without emojis have a higher open rate (53.94%) compared to those with emojis (47.06%).*

Email Frequency Statistics
How many emails you send also has an impact on your email marketing success, just like what you include in your emails. Here are some numbers:
- Consumers prefer to receive emails from their favorite brands just a few times per month.*
- Sending 5-8 emails per month frequency shows highest ROI of about $48 per $1 spent.*
- 54% of brands opt to send emails 2-4 times per month, with 32% sending emails once a month.
- Fewer brands send emails 5-9 times per month (8%) or more frequently (6%).*
- Sending emails once a month had the highest open rate at 28%, with 2-4 emails a month following closely behind.*
In the B2C sector, some studies suggest trying frequencies as high as 10-19 times a month for potentially higher sales, though this might not suit every audience. For B2B communications, most companies find emailing twice a month optimal, as increasing the frequency to more than once a week significantly boosts the unsubscribe rate.
Email Marketing Targeting and Personalization Stats
Email Segmentation Statistics
Segmentation plays a crucial role in deciding the success of email marketing campaigns. Subscriber segmentation that drives lift like this is built into most modern ESPs. Here’s some research data:
- Segmented email campaigns drive 30% more opens and 50% more click-throughs than unsegmented ones.*
- 78% of marketers state that the most effective strategy for email marketing campaigns is subscriber segmentation.*
- 4 out of 5 marketers personalize subscriber profile data and 64% use customer segments.*

Personalized Email Marketing Statistics
Personalization is a big trend that can drive a positive impact for your campaigns. For a fuller set of personalization statistics beyond what’s in this roundup, see the dedicated breakdown. In fact, using dynamic content in emails is a top tactic used by email marketers.
Here are some statistics about personalized email performance:
- Message personalization is one of the top tactics to optimize emails.*
- Research shows that personalized emails generate 6x higher transaction rates compared to non-personalized versions.*
- 88% of users agree they are more likely to respond to an email favorably if it looks like it’s been specifically created for them.*
- Email marketers who segmented their audience before campaigning stated that the revenue generated increased to up to 760%.*
- 80% of customers are more likely to purchase after a personalized experience.*
AI and Personalization Statistics
AI is changing the email marketing game by helping brands create super-personalized campaigns that actually speak to what each customer wants, making emails way more relevant and effective.
Here are some important statistics:
- 91% of marketing leaders say employees/teams at their organization use AI to assist them in their job.*
- 43% of marketers who use generative AI say it’s most helpful for creating email copy.*
- AI-driven email marketing leads to a 13% increase in click-through rates and 41% rise in revenue.*
- Using AI for email personalization has led to a 13.44% increase in click-through rates for marketers in 2025.*
Email Marketing Automation and Efficiency Statistics
Did you know 87% of marketers use marketing automation for emails? If you want better results, you must leverage automation. We’re not saying that, but the numbers don’t lie. Check the latest marketing automation email statistics in the next section.
Email Automation Statistics
If you ask marketers, they’ll say that email automation is the best thing since sliced bread. An automation-first email service provider helps you send the right message to the right audience at the right time, every time.
Let’s look at some automated email workflow statistics to support the theory:
- Email automation campaigns (71%) are the third most effective email marketing strategy after subscriber segmentation (78%) and message personalization (72%).
- 48% of marketers said they plan to apply email marketing automation in their email campaigns.*
- Automated emails triggered by specific user actions (sign-up or cart abandonment) can generate 320% more revenue than standard campaigns.
- Automated birthday emails achieve 43.3% open rate and 14.3% click-to-conversion rate.
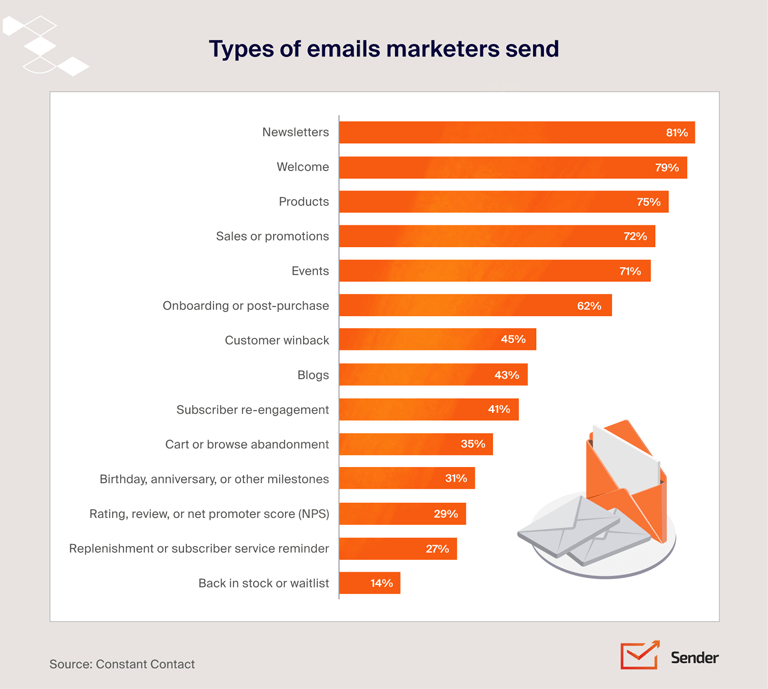
Types of Emails Marketers Send
Email marketing is effective in reaching diverse audiences, engaging them, and achieving significant ROI. Here’s some analytical data to illustrate it:
- Newsletters are the most popular email type, used by 81% of marketers.*
- Welcome emails follow closely at 79%.*
- Product emails highlighting specific products or features are used by 75%.*
- Sales or promotions emails make up 72% of all emails sent by marketers.*
- Event announcements are sent by 71% of marketers.*
- Onboarding or post-purchase emails are used by 62% of brands and marketers.*
Brands are also known to utilize customer winbacks, blogs, re-engagement, and cart abandonment emails throughout the buyer’s lifecycle.
Email Send Time Statistics
Best Day to Send Email Marketing Campaigns
When it comes to email marketing, timing matters almost as much as content. The day you schedule your campaign can have a noticeable impact on engagement and performance.
Below are several data points on the best days to send marketing emails.
- Tuesday is widely considered one of the best days to send email marketing campaigns, especially when emails are scheduled around 7 AM or 11 AM*;
- Tuesday through Thursday generally deliver the highest engagement for email campaigns, while Mondays and Fridays tend to perform worse*;
- More than 85% of opened marketing emails and over 90% of clicked marketing emails are sent on weekdays (Mon-Fri)*.
Best Time to Send Marketing Emails
Choosing the right time to send marketing emails can significantly impact open rates, engagement, and overall performance.
That said, here are the peak times for those marketing emails:
- Optimal days vary by industry—for example, ecommerce and SaaS campaigns often perform best on Tuesday or Thursday, while some B2B sectors see stronger results on Monday or Wednesday*;
- The highest average open rate of the week occurs on Friday at around 6 PM (49.7%), when many people finish work and begin checking personal emails, newsletters, and non-urgent messages*.
B2B, B2C, and Industry-Specific Insights
Whether you’re in the B2B or B2C industry, email marketing can work wonders for both. We’ve curated the latest email marketing statistics for the B2B & B2C industries:
B2B Email Marketing Statistics
For the B2B industry, email marketing is the primary method to distribute content and nurture leads.
Here’s the latest B2B email marketing data:
- 81% of B2B marketers say their most used form of content marketing is email newsletters.*
- 69% of B2B marketers use email to distribute content in the last 12 months.*
- 14.3% of all emails go missing or get caught by popular spam filters.*
- B2B marketers say that new product and feature announcement marketing emails have the highest click-through rate.*
- B2B buyers and consumers feel overwhelmed by the volume of emails, and 67% set up a junk email account to dodge unwanted emails.*
B2C Email Marketing Statistics
Email is one of the most rewarding channels for B2C businesses if you look at open rates, click rates, and conversion rates. Here are the latest B2C email marketing insights:
- 87% of B2C marketers leverage automation as part of their email marketing strategy.*
- 60% of retail, ecommerce, and consumer goods and services companies are personalizing emails based on past purchases, versus 38% in 2019.*
- More than 8 out of 10 people will open a welcome email, generating 4x as many opens and 10x as many clicks as other email types.*
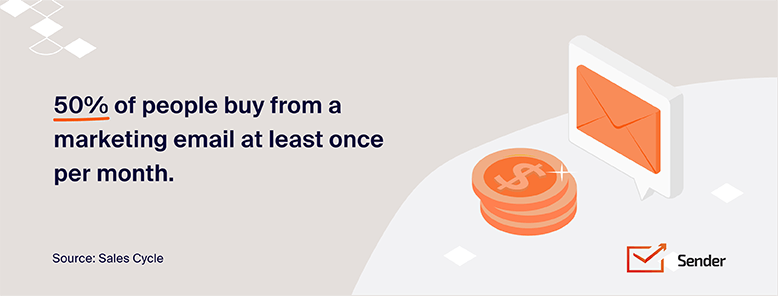
- 50.7% of people make purchases at least once monthly from email suggestions.*
- 64% of B2C marketers consider accessibility when creating their emails.*
Ecommerce Email Marketing Statistics
As an ecommerce business owner or marketer, these statistics are not just interesting, but directly relevant to your business:
- 34% of consumers are more likely to purchase from email marketing.*
- 59% of people say that email marketing affects purchasing decisions.*
- 60% of consumers made a purchase thanks to a marketing email they received.*
- 51% of US online shoppers prefer email channels over other options (in-app notifications, SMS, and push notifications) to receive discounts.*
- Open rates for cart abandonment email flows come in at 49.89%, bringing an average revenue of $3.58 per recipient (nearly 2x of the average revenue across all campaigns – $1.91).*
Technical Aspects and User Experience
If you want to create a great email marketing strategy, you must also look at technical aspects as well as user experience. Our curated statistics will guide your decision-making.
Email Deliverability Stats
Nearly 1 in 7 marketing emails never make it to the inbox, emphasizing the need for strategic email practices to enhance deliverability. Here’s some useful numerical data to rethink about email deliverability rates:
- In 2025, the average email deliverability, or inbox placement rate, rate was 83-84%.*
- 61% of marketers say improving email deliverability rates is a big challenge.*
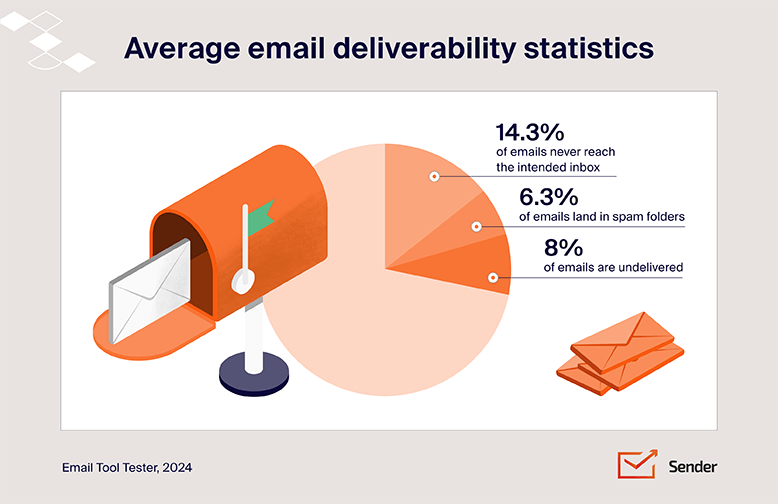
- 14.3% of emails never reach the intended inbox. 6.3% of emails land in spam folders, and 8% of emails are undelivered.*
- North America leads the globe with an 87.9% deliverability rate.*
- Managing email deliverability is getting harder, with 44% of marketers reporting Microsoft as the toughest mailbox provider for deliverability, followed by Gmail.*
Email Bounce Rate Statistics
No one likes when their email cannot get delivered, but email bounce comes with the email marketing territory. Here are some statistics that illustrate how common they are.
- A healthy email bounce rate is typically below 2%*
- The average email bounce rate across industries is 0.55%*
- In some industries, bounce rates are higher—for example, construction emails average around 1.89% bounce rate.*
- By contrast, ecommerce emails average a much lower bounce rate of around 0.39%.*
- Email providers often flag lists when bounce rates exceed 2–3%*
Spam Complaint Rate Statistics
Even well-crafted emails can sometimes be marked as spam, making spam complaint rates an important metric to watch in email marketing.
Here are some statistics that highlight how common spam complaints are and why they matter.
- A healthy spam complaint rate for email marketing is typically below 0.1%*;
- The average spam complaint rate is around 0.07%*;
- About 44% of marketers maintain spam complaint rates at or below 0.1%*;
- Email providers often flag senders when spam complaint rates exceed 0.1–0.3%*.
Mobile Device Email Marketing Statistics
People open their emails on mobile more than on desktops. Here are some interesting mobile email marketing statistics:
- 75% of Gmail users use their mobile device to access their accounts.*
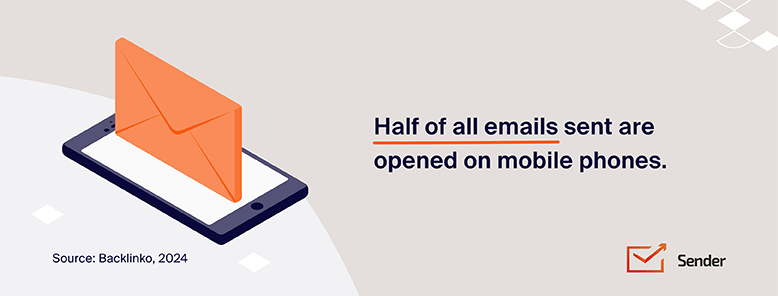
- 64% of emails are opened on mobile devices.*
- 60% of people check their emails first thing in the morning on their smartphones.*
- iPhone email app accounted for 29% of email opens. Gmail was ranked second with a 28% open share.*
Email Unsubscribe Rates
Email unsubscribers show that your content is not really valuable to your audience. Data from multiple sources have suggested average unsubscribe rates:
- The average unsubscribe rates vary between 0.07% and 0.2%;
- The unsubscribe rates have fallen down to 0.03% in the past year;
- Spam complaint rate has more than doubled to 0.07% during the same time, meaning more people are complaining rather than just unsubscribing.
Numbers tell you what’s normal — but knowing what’s normal isn’t the same as knowing what to do. For the strategic side of the picture, the full email marketing playbook walks through how to act on these benchmarks.
*Sources:
- https://www.barilliance.com/email-marketing-statistics/
- https://emarsys.com/press-release/emarsys-survey-finds-smbs-quickly-adapting-omnichannel-paradigm-compete/
- https://www.emailtooltester.com/en/blog/email-marketing-statistics/
- https://www.emailtooltester.com/en/blog/email-deliverability-statistics/
- https://www.emailtooltester.com/en/blog/spam-statistics/
- https://www.emailtooltester.com/en/blog/ecommerce-email-marketing-statistics/
- https://knowledgebase.constantcontact.com/email-digital-marketing/articles/KnowledgeBase/5409-average-industry-rates?lang=en_US
- https://www.litmus.com/wp-content/uploads/pdf/The-2023-State-of-Email-Workflows-Report.pdf
- https://www.litmus.com/wp-content/uploads/pdf/The-2023-State-of-Email-Report.pdf
- https://contentmarketinginstitute.com/wp-content/uploads/2021/10/B2B_2022_Research.pdf
- https://emt.gartnerweb.com/ngw/globalassets/en/marketing/documents/digital_iq_email_marketing_benchmarks_2022.pdf
- https://www.mckinsey.com/capabilities/growth-marketing-and-sales/our-insights/why-marketers-should-keep-sending-you-emails
- https://abmatic.ai/blog/power-of-personalization-in-email-marketing
- https://www.constantcontact.com/blog/email-marketing-research-and-statistics/
- https://www.getresponse.com/resources/reports/email-marketing-benchmarks
- https://www.statista.com/statistics/812060/email-marketing-revenue-worldwide/
- https://www.hubspot.com/state-of-marketing
- https://www.brafton.com/blog/email-marketing/the-history-of-email-marketing/
- https://sopro.io/resources/whitepapers/the-state-of-prospecting-23/
- https://contentmarketinginstitute.com/articles/b2b-power-content-marketing-research/
- https://blog.hubspot.com/marketing/hubspot-blog-marketing-industry-trends-report
- https://www.gartner.com/en/marketing/research/digital-iq-email-marketing-benchmarks
- https://truelist.co/blog/mobile-email-statistics/
- https://www.pathwire.com/research/accessibility-email-inbox/
- https://backlinko.com/email-marketing-stats
- https://www.litmus.com/email-client-market-share/
- https://www.litmus.com/blog/infographic-the-roi-of-email-marketing/
- https://www.salecycle.com/blog/featured-en-us/18-essential-email-marketing-statistics/
- https://www.emarketer.com/insights/email-marketing-personalization-trends/
- https://www.notifyvisitors.com/blog/segmentation-statistics/
- https://www.sequeldm.com/directmailreport/
- https://www.klaviyo.com/marketing-resources/email-benchmarks-by-industry
- https://www.campaignmonitor.com/resources/guides/email-marketing-new-rules/
- https://www.getresponse.com/resources/reports/email-marketing-benchmarks
- https://www.drip.com/blog/email-marketing-statistics
- https://snov.io/blog/email-frequency-best-practices/
- https://www.radicati.com/wp/wp-content/uploads/2023/04/Email-Statistics-Report-2023-2027-Executive-Summary.pdf
- https://www.validity.com/wp-content/uploads/2024/02/The-State-of-Email-in-2024-Keeping-Ahead-of-the-Curve.pdf
- https://debounce.io/email-spam-statistics/
- https://www.omnisend.com/2025-ecommerce-marketing-report/
- https://superagi.com/future-of-email-marketing-how-ai-subject-line-generators-are-revolutionizing-open-rates-and-conversions/
- https://porchgroupmedia.com/blog/100-compelling-email-statistics-to-inform-your-strategy-in-2023/
- https://www.getresponse.com/blog/email-marketing-statistics
- https://www.zerobounce.net/email-statistics-report/
- https://www.litmus.com/blog/the-roi-for-email-marketing-the-good-news-and-the-bad-news
- https://blog.hubspot.com/marketing/state-of-ai-report
- https://www.hubspot.com/marketing-statistics
- https://www.statista.com/chart/17222/artificial-intelligence-marketing/
- https://entrepreneurshq.com/email-marketing-statistics/
- https://blog.hubspot.com/marketing/email-marketing-stats
- https://designmodo.com/email-marketing-roi-statistics/
- https://www.litmus.com/blog/how-the-worlds-best-email-brands-run-a-b-tests
- https://www.ruleranalytics.com/blog/insight/conversion-rate-by-industry/#email-conversion-rates
- https://selzy.com/en/benchmarks/email-marketing-benchmarks-research-by-industry/
- https://www.mailerlite.com/blog/compare-your-email-performance-metrics-industry-benchmarks
- https://www.webfx.com/blog/marketing/email-marketing-benchmarks/
- https://www.twilio.com/en-us/blog/ideal-email-subject-length
- https://www.twilio.com/en-us/blog/insights/the-best-time-to-send-your-email-campaign
- https://www.salesforce.com/eu/marketing/email/best-time-to-send-emails/
- https://www.brevo.com/blog/best-time-to-send-email/
- https://www.mailerlite.com/blog/best-time-to-send-email
- https://www.campaignmonitor.com/blog/featured/the-5-email-marketing-metrics-that-matter-most-and-how-to-improve-them/
- https://www.mailerlite.com/blog/understanding-soft-and-hard-bounced-emails
- https://www.campaignmonitor.com/resources/guides/reporting
- https://www.klaviyo.com/blog/email-deliverability-tips
- https://www.statista.com/statistics/456500/daily-number-of-e-mails-worldwide/
- https://www.statista.com/statistics/255080/number-of-e-mail-users-worldwide/
- https://www.bluecore.com/blog/how-millennials-use-email/
- https://www.nngroup.com/articles/emojis-email/
- https://humanic.ai/blog/32-ai-for-email-marketing-statistics-2024-2025-data-every-marketer-needs
- https://blog.hubspot.com/marketing/state-of-generative-ai
- https://support.google.com/a/answer/81126